How to Analyse ASX Bank Stocks Using 3 Key Metrics
9 hrs ago

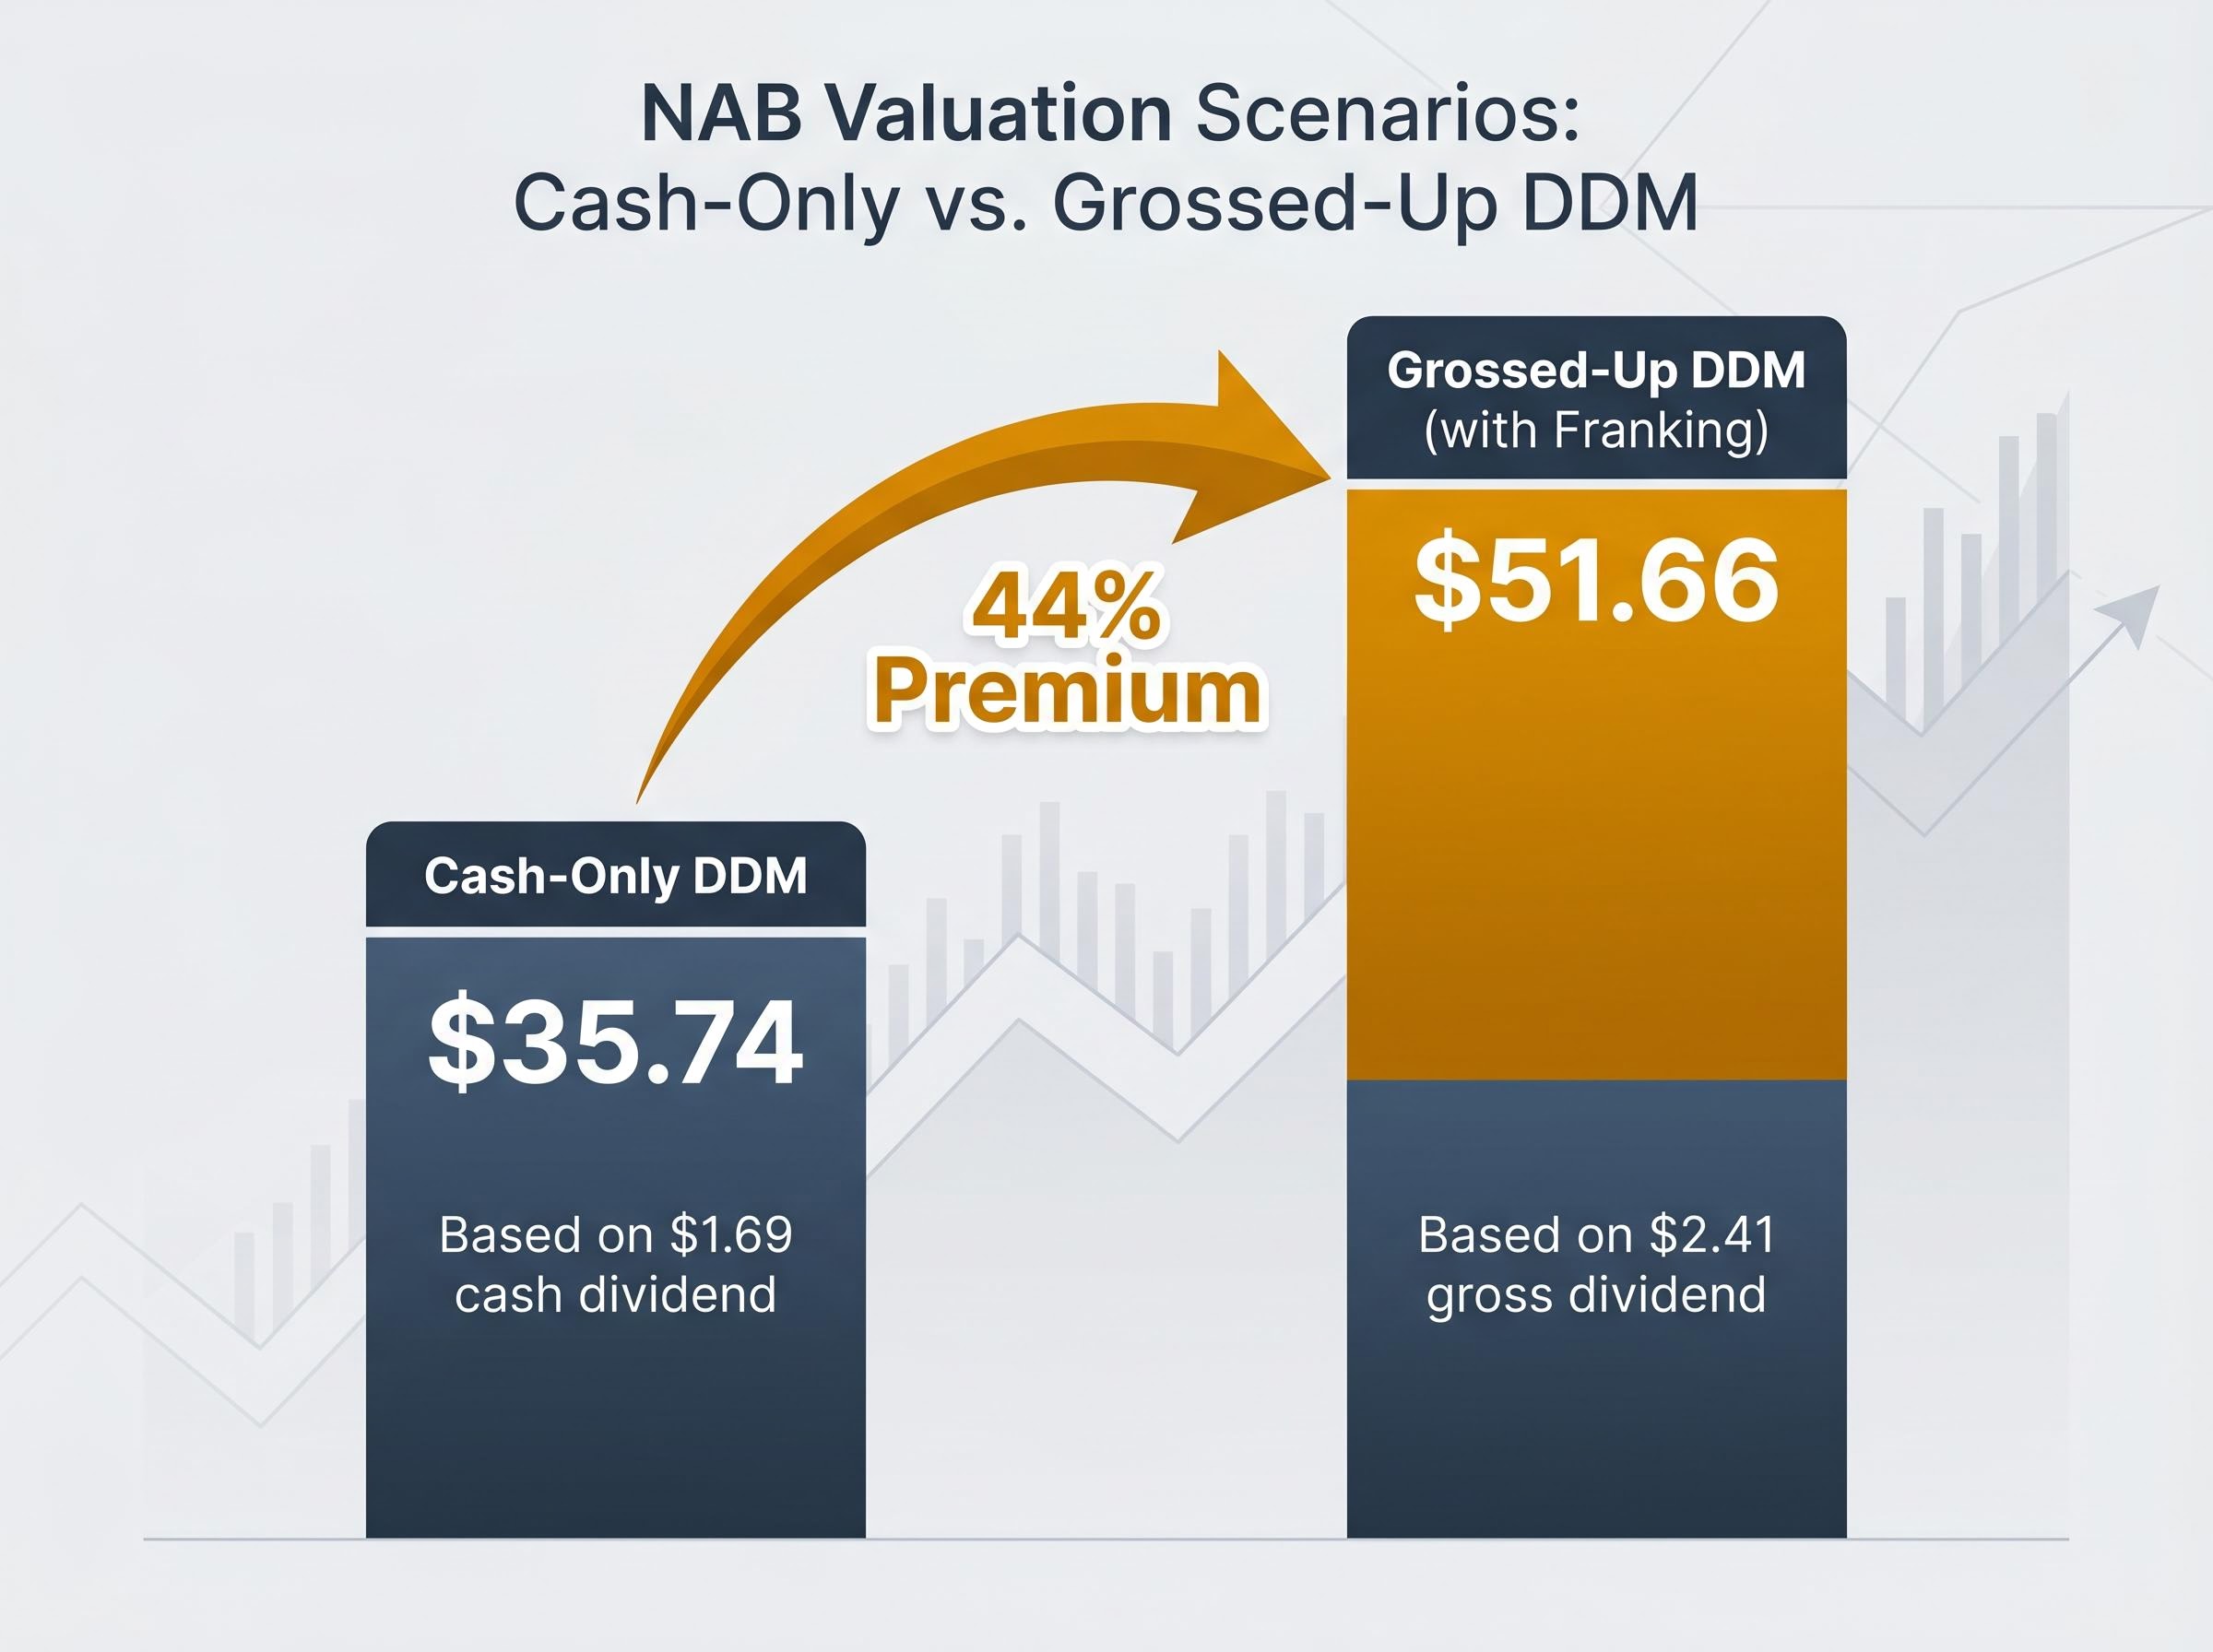
A basic Dividend Discount Model values National Australia Bank shares at roughly $35.74. Add franking credits, and that estimate jumps to $51.66. The difference is not a rounding error; it is the entire argument for why Australian investors need a different version of this model.
The Dividend Discount Model is one of the oldest equity valuation tools in finance, and for income-generating stocks like the ASX big four banks it has an intuitive appeal: if a share’s value comes from the cash it sends back to investors, discount those future cash flows and you have a price. But the standard textbook version was built for markets where dividends are just dividends. In Australia, fully franked dividends carry embedded tax credits that represent real cash in the hands of eligible investors, and ignoring them produces a materially different answer.
This article explains how the Dividend Discount Model works from first principles, walks through a live NAB-based worked example using current dividend data, shows exactly how franking credits change the fair value output, and covers the sensitivity traps and model limitations every investor should understand before acting on a DDM number.
The core logic is elegant. If a share’s entire purpose is to generate future dividends, then the share is worth the sum of those future dividends, discounted back to today’s dollars. For a company expected to grow its dividend at a steady rate indefinitely, the maths simplifies to a single formula:
Share Price = D / (r – g)
Where D is the annual dividend per share, r is the required return (discount rate), and g is the expected long-run dividend growth rate.
That formula works best when three conditions hold: dividends are regular, the payout ratio is stable, and the business reinvests only modestly relative to what it earns. Mature ASX banks satisfy all three.
The origins of the dividend discount model trace back to John Burr Williams in 1938, who developed the framework as a direct reaction to the speculative excess of the 1920s, anchoring equity value to future income rather than price momentum, a discipline that remains embedded in the CFA Institute curriculum and active institutional practice today.
APRA’s Prudential Standard APS 110 sets the capital adequacy framework that determines minimum CET1 ratios for authorised deposit-taking institutions, creating the regulatory floor that anchors NAB’s dividend policy within a predictable band.
NAB declared a full-year dividend of 169 cents per share ($1.69) in FY2024, fully franked. That figure becomes the starting point for the worked example that follows.
The formula is simple. The assumptions are not.
Two variables do almost all the work in a DDM: the discount rate (r) and the long-run growth rate (g). Practitioners covering ASX banks typically use a discount rate of 8-11%, reflecting the risk-free rate plus an equity risk premium appropriate for a regulated but cyclical bank. Terminal growth rates cluster around 3-4% nominal, anchored to long-run nominal GDP growth. Nathan Zaia at Morningstar uses low-single-digit nominal growth for NAB and peers, while Andrew Clifford at Platinum Asset Management applies approximately 3% nominal as a terminal rate.
The table below shows what happens when those assumptions are varied across a plausible range, using NAB’s $1.69 historical dividend per share.
| Growth Rate (g) | r = 8% | r = 9% | r = 10% | r = 11% |
|---|---|---|---|---|
| 2% | $28.17 | $24.14 | $21.13 | $18.78 |
| 3% | $33.80 | $28.17 | $24.14 | $21.13 |
| 4% | $42.25 | $33.80 | $28.17 | $24.14 |
The spread is the point. At the practitioner midpoint of a 9% discount rate and 3% growth rate, the model produces a fair value of approximately $28.17 per share. Across the full matrix, the average output sits around $35.74, according to modelling by the Rask Invest Research Team.
At a 9% discount rate and 3% growth rate, the DDM produces a fair value of approximately $28.17 per share using NAB’s historical dividend. The matrix average across all scenarios is roughly $35.74.
That range, from under $19 to over $42, is not a flaw. It is the model telling investors that their assumptions matter more than the formula.
Using a trailing dividend assumes the past is the best guide. Most practitioners prefer a forward-looking input. Morgans forecasts NAB’s FY26 dividend per share at $1.76, while Macquarie projects $1.75. A blended forward estimate of approximately $1.71 shifts the central DDM output to around $36.16, according to Rask Invest modelling.
Even with the slightly higher forecast dividend, the unadjusted DDM output remains below NAB’s current share price of $37.85. That gap closes, dramatically, once franking credits enter the picture.
A franking credit represents corporate tax already paid on the profit behind a dividend. When an Australian company pays a fully franked dividend, it attaches a credit reflecting the 30% corporate tax rate. For investors who can use that credit, whether as a tax offset or a cash refund, the dividend is worth more than the cash amount alone.
The grossing-up calculation takes two steps:
Plugging that $2.41 gross dividend into the same DDM framework lifts the estimated fair value to approximately $51.66, according to Rask Invest Research Team modelling. That is a 44% premium over the cash-only estimate of $35.74.
The uplift is consistent with published literature. BetaShares, Rask Australia, and Motley Fool Australia each cite a franking credit uplift range of 30-50% in a DDM context for fully franked bank shares, with the precise figure depending on the investor’s tax position.
“Some DDM models we run for SMSFs use grossed-up dividends because franking credits are real cash refunds for those investors,” said Sean Fenton of Sage Capital.
NAB’s franking credit balance stood at $2.4 billion as at 31 March 2025, confirming the bank’s capacity to maintain fully franked distributions at current payout levels.
One note of caution: treating franking credits as perpetual cash flows in a DDM carries legislative risk. The 2019 franking credits refund policy debate illustrated how quickly the value of those credits can become a political question, a risk no standard model assumption captures.
The answer depends entirely on the investor’s tax position. An SMSF in pension phase pays zero tax and receives franking credits as a full cash refund; the grossed-up DDM is the more accurate reflection of value for that investor. A high-income earner with a marginal tax rate above 30% receives less benefit from the credit than the grossing-up formula implies, meaning the grossed-up DDM likely overstates value for them. A standard retail investor in accumulation phase falls somewhere between the two, depending on their personal tax rate.
This is not a universal adjustment. It is an investor-specific calculation, and applying the wrong version produces a misleading output.
The DDM has just produced a range of outputs spanning roughly $19 to $52 for a single stock. That range should prompt caution, not confidence.
Owen Raszkiewicz at Rask Australia has noted that DDM valuations are “highly sensitive to small changes in discount rate and growth assumptions,” particularly when the growth rate approaches the discount rate. A 1% shift in either variable can move the output by 20% or more, giving investors a false sense of precision when the future path of earnings is uncertain.
Credit cycles compound the problem. Andrew Clifford at Platinum has observed that DDMs “tend to smooth out the credit cycle,” but bad debt charges can cause dividend cuts in recessions. Clifford prefers scenario-based stress tests under higher unemployment and declining house prices, approaches that the DDM’s smooth growth assumption cannot replicate.
Regulatory surprises add a further layer. Nathan Zaia at Morningstar has pointed out that DDMs assuming stable payout ratios can break down when APRA changes capital settings, citing COVID-era dividend cuts as a recent example. UBS has similarly flagged that future regulatory changes are “difficult to model within a standard DDM,” making the approach less reliable for banks than for more stable sectors such as utilities.
Four structural limitations deserve attention:
The ASX Investor Update recommends using the DDM alongside three complementary approaches: the price-to-earnings ratio, which provides a snapshot of current earnings relative to market price; the price-to-book ratio, which measures balance sheet value against what the market is willing to pay; and ROE-based valuation, which links profitability efficiency to book value and market price. Together, these tools reduce the risk of anchoring on any single model’s output.
DDM and PE valuation convergence carries more analytical weight than any single model output: where both methods produce similar fair value estimates for the same stock, as illustrated in a CBA worked example where franking-adjusted DDM and sector-PE outputs align, the overlap provides a stronger basis for conviction than either method used in isolation.
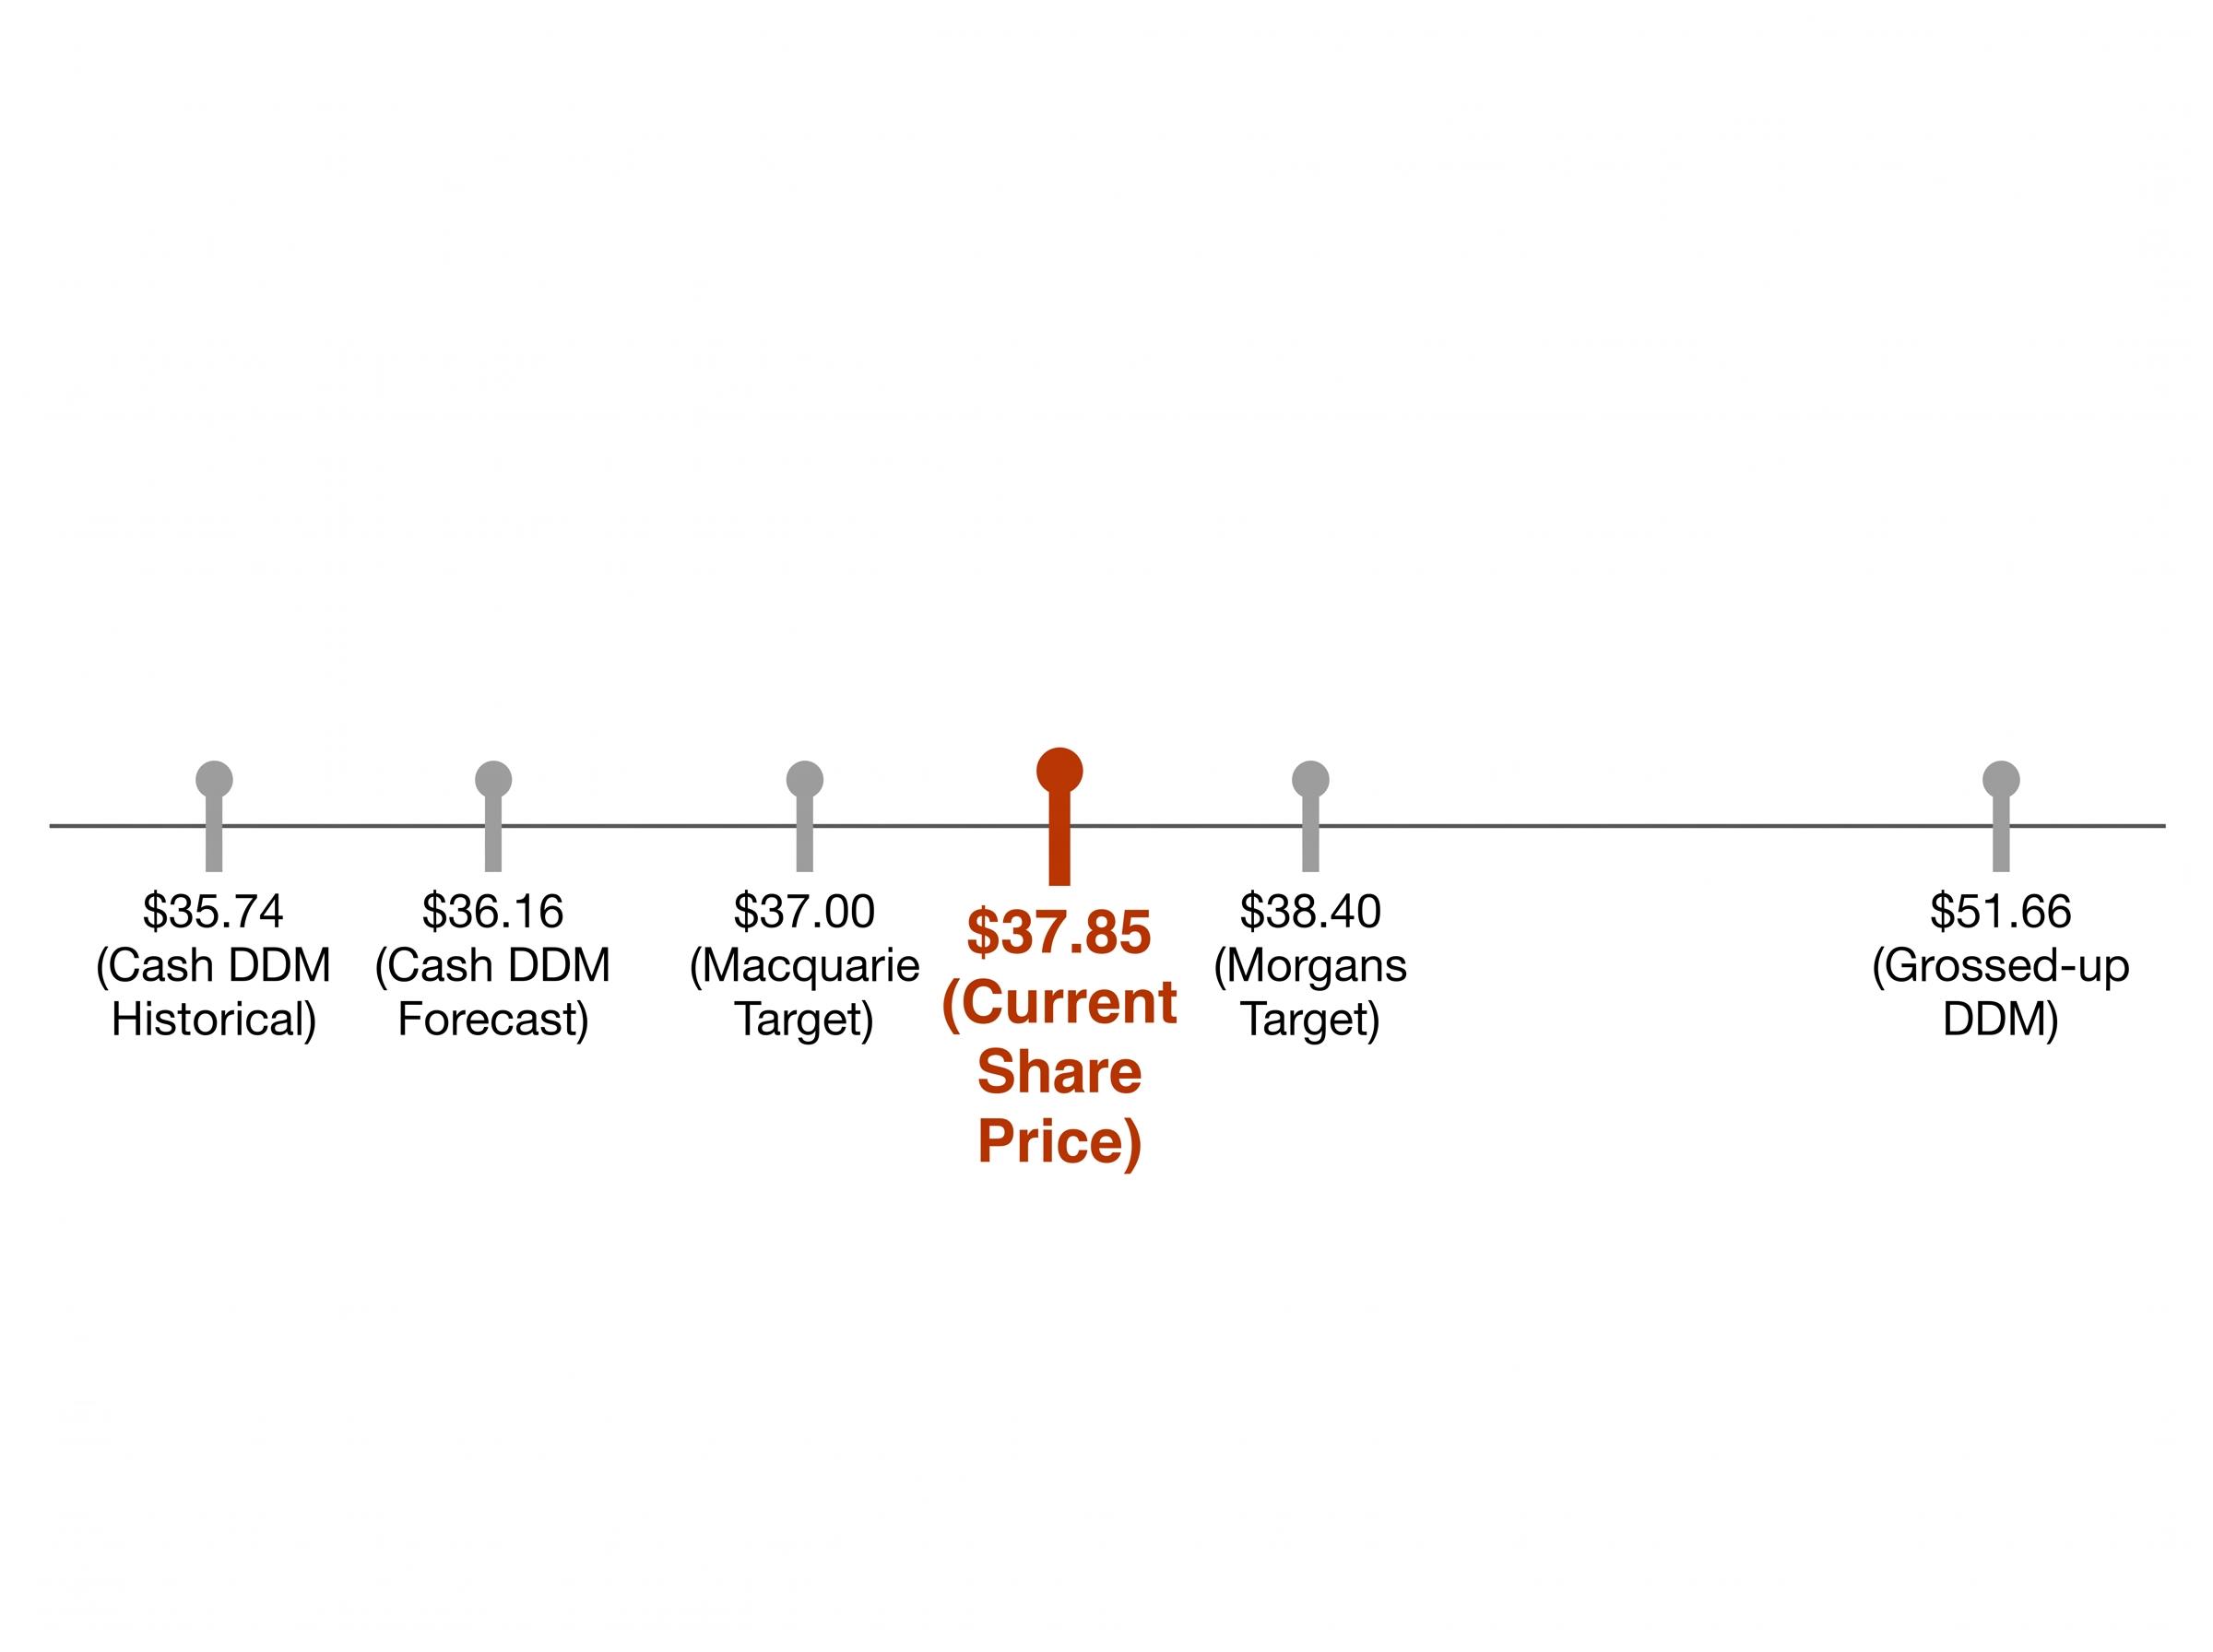
The full range of DDM outputs for NAB spans from approximately $35.74 (cash-only, historical dividend) to $51.66 (grossed-up for franking). The current share price of $37.85 sits just above the cash-only estimate, broadly aligned with broker price targets from Morgans ($38.40, Add) and Macquarie ($37.00, Neutral).
| Valuation measure | Value | Key assumption | Most relevant to |
|---|---|---|---|
| Cash DDM (historical DPS) | $35.74 | $1.69 DPS, scenario average | Taxable investors unable to fully utilise franking credits |
| Cash DDM (forecast DPS) | $36.16 | $1.71 forward DPS | Taxable investors using forward estimates |
| Grossed-up DDM | $51.66 | $2.41 gross DPS (franking included) | SMSFs in pension phase and low-tax investors |
| Broker target range | $37.00 – $38.40 | Earnings-based models | All investors (consensus reference) |
Dividend sustainability supports the current payout level under normal conditions. NAB’s FY2024 payout ratio of 68.4% falls within the 60-70% post-APRA framework norm. The bank’s CET1 ratio of 12.35% provides a buffer above regulatory minimums, and its $2.4 billion franking credit balance underpins its capacity to maintain fully franked distributions.
The variable to watch is net interest margin. NAB’s NIM of 1.71% sits below the 1.78% peer average, and analysts expect NIM headwinds to persist.
Nathan Zaia at Morningstar expects “modest dividend growth in line with earnings, not major payout expansion from here.”
Morgans forecasts FY26 DPS of $1.76 and Macquarie projects $1.75, implying low-single-digit growth. No single DDM output is a buy or sell signal. The model’s value lies in comparing an investor’s own assumptions against the market’s implied assumptions, and the gap between the two tells a more useful story than any single cell in the matrix.
ASX 200 dividend yield compression, with the index sitting at approximately 3.3% in late 2025 against its 10-year historical average of 4.3%, has a direct bearing on how DDM outputs should be interpreted: when the market is pricing income streams at a premium to historical norms, a DDM fair value below the current share price is not automatically a sell signal but may reflect broader repricing of yield assets.
Running a DDM on any ASX bank share follows three steps:
Run a scenario matrix, not a single estimate. Test at least three discount rates against two or three growth rates, and examine the spread of outputs rather than fixating on the centre.
Four practical guardrails help avoid the most common modelling mistakes:
For Australian investors in low-tax or tax-exempt structures, the franking credit adjustment is not a refinement. It can shift the estimated fair value by 30-50%, according to published analysis from BetaShares, Rask Australia, and Motley Fool Australia. That is the difference between viewing a bank share as fairly priced and viewing it as materially undervalued.
The DDM offers a structured valuation lens for ASX bank income investors, and the franking credit adjustment is not optional for Australians in low-tax structures. It fundamentally changes what a share is worth to them. For NAB, the difference between the cash-only and grossed-up fair value estimates spans roughly $16 per share, a gap too large to treat as a modelling footnote.
The model’s limits are equally clear. Sensitivity to assumptions, credit cycle risk, APRA capital uncertainty, and policy risk on franking credits all mean the DDM works best as a starting framework, not a final answer. Investors who rely on it in isolation risk anchoring on a number that a single assumption change could shift by 20% or more.
Further due diligence should include reviewing NAB’s annual reports, monitoring NIM and payout ratio trends, and stress-testing DDM assumptions against adverse scenarios including higher bad debts and potential regulatory capital calls. No valuation model replaces a rounded assessment of the business behind the dividend.
For investors ready to layer macro data into their bank stock analysis, our comprehensive walkthrough of ASX bank valuation beyond DDM covers RBA rate path scenarios, CoreLogic property trend inputs, and APRA arrears statistics alongside a Westpac DDM sensitivity matrix, showing how the same fragility in DDM assumptions identified here plays out across a second big four bank.
This article is for informational purposes only and should not be considered financial advice. Investors should conduct their own research and consult with financial professionals before making investment decisions. Past performance does not guarantee future results. Financial projections are subject to market conditions and various risk factors.
The Dividend Discount Model (DDM) is an equity valuation method that estimates a share's fair value by discounting all future expected dividends back to today's dollars. For a company with stable dividend growth, the formula simplifies to: Share Price = D / (r - g), where D is the annual dividend, r is the required return, and g is the long-run growth rate.
Fully franked dividends carry embedded tax credits representing corporate tax already paid, which are real cash for eligible investors such as SMSFs in pension phase. Grossing up NAB's $1.69 cash dividend to $2.41 lifts the DDM fair value estimate from roughly $35.74 to approximately $51.66, a difference of around 44%.
Practitioners covering ASX major banks typically apply a discount rate of 8-11%, reflecting the risk-free rate plus an equity risk premium, and a long-run dividend growth rate of 2-4% nominal, anchored to long-run nominal GDP growth rather than historical dividend growth alone.
ASX major banks are ideal DDM candidates because they maintain high and stable payout ratios (NAB paid out 68.4% of cash earnings in FY2024), declare dividends every half-year with a long track record, and operate under APRA capital requirements that anchor dividend policy within a predictable band.
The DDM is highly sensitive to small changes in the discount rate or growth rate, with a 1% shift in either variable potentially moving the output by 20% or more. Additional limitations include the model's inability to capture credit cycle dividend cuts, APRA regulatory capital surprises, and legislative risk around franking credit refund rules.