How to Manage AI Stock Concentration Risk in Your Portfolio
5 hrs ago

The P/E model says Bank of Queensland (BOQ) is trading below sector-average fair value at around $7.46. The dividend discount model (DDM) central estimate clusters around $7.19 to $7.40. And yet experienced bank analysts routinely caution that this is exactly where the hard work begins, not where it ends. Quantitative outputs are built on assumptions about future earnings, margins, and growth rates. For a regional bank like BOQ, those assumptions are unusually sensitive to factors that never appear in a spreadsheet: regulatory standing, funding mix, geographic concentration, management continuity, and the macroeconomic backdrop. This guide provides a structured checklist of qualitative and macroeconomic layers to investigate after the numbers are run, so investors can form a genuinely informed judgement rather than stopping at the model output.
A trailing earnings per share (EPS) figure of $0.41 for FY24 against a share price of approximately $6.35 in late May 2026 gives BOQ an implied price-to-earnings ratio of roughly 15.5x. The ASX banking sector average sits closer to 18x. Apply that sector average to BOQ’s earnings and the implied fair value lands near $7.46, a figure that looks straightforward on a spreadsheet.
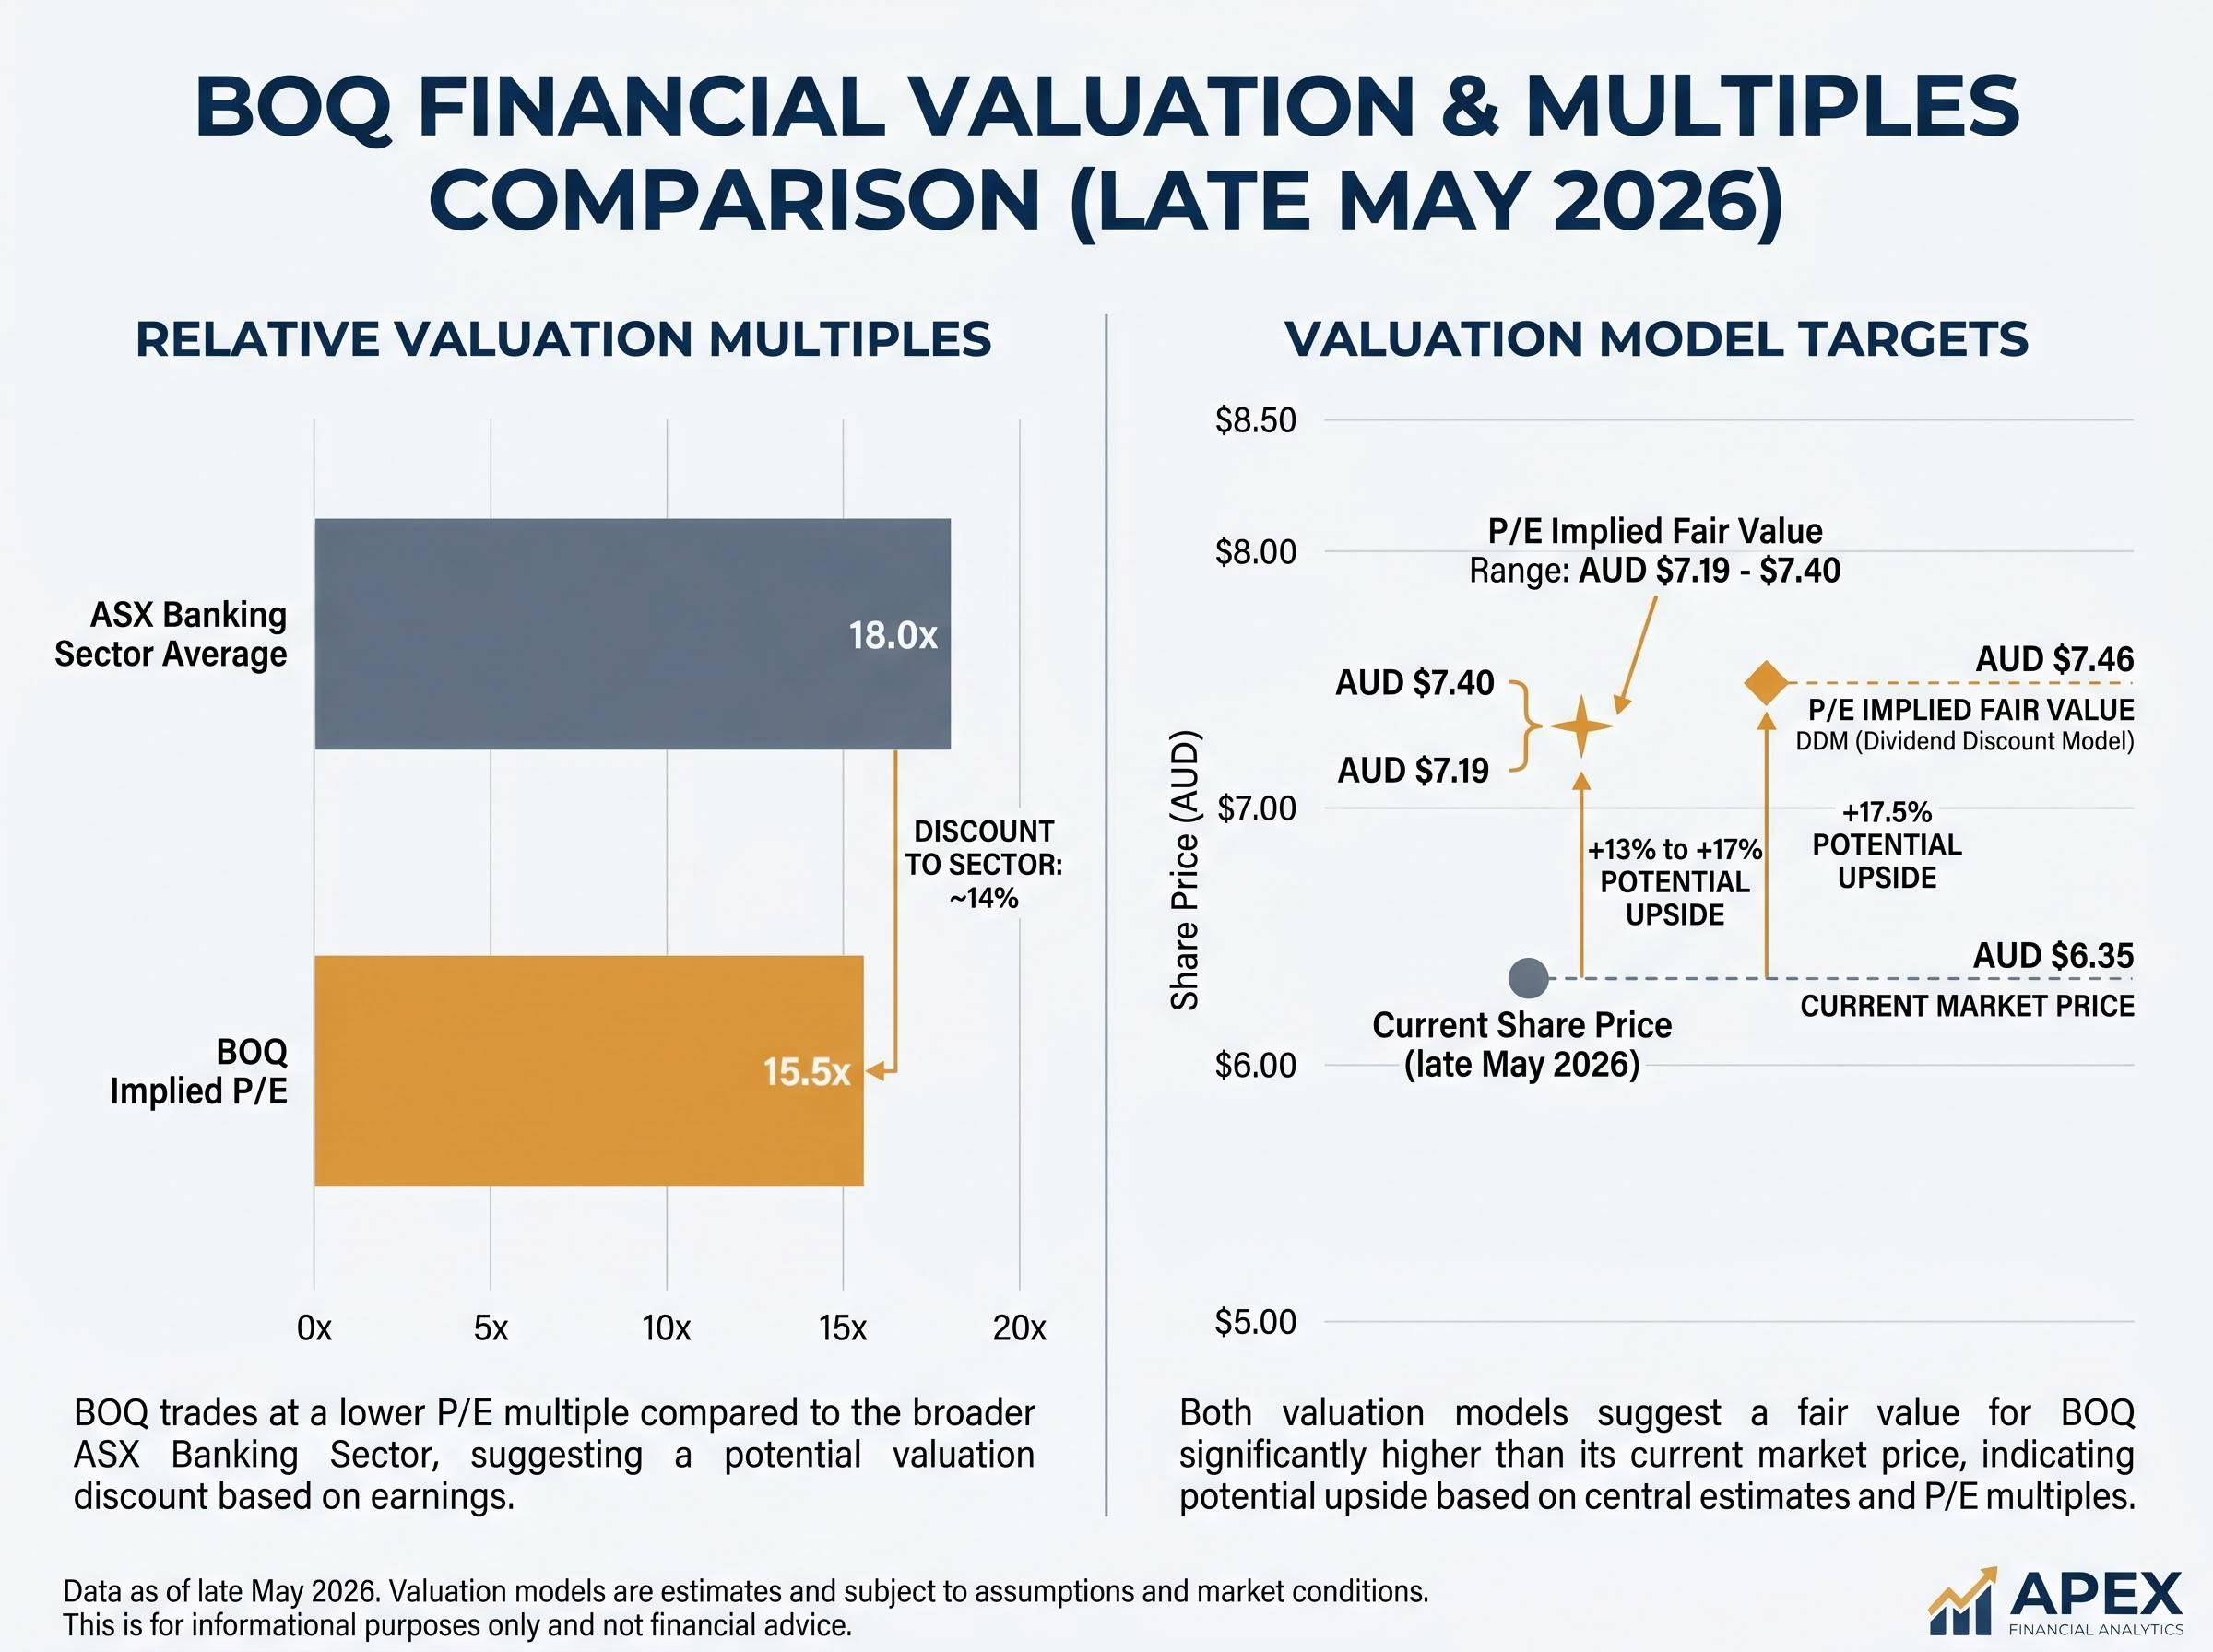
It is not. That 18x multiple treats BOQ as structurally equivalent to the major banks. It is not.
The range of valuation methods for ASX bank stocks, including PE, price-to-book, DDM, and DCF, each carry specific limitations for bank earnings that can be distorted by credit cycles, remediation charges, and one-off regulatory capital changes, which is why no single model output is sufficient on its own.
The discount exists for reasons that are structural, not temporary, and investors who can articulate those reasons are better positioned to judge whether the current gap has already been priced in or whether there is further to fall.
The single largest qualitative differentiator between a major bank and a regional is the composition of funding. Major banks draw a substantial share of their deposits from low-cost transaction accounts and at-call savings accounts. Regional banks like BOQ rely more heavily on term deposits and wholesale market funding, both of which carry higher interest costs. This difference directly compresses net interest margin (NIM), the spread between what a bank earns on its loans and what it pays for deposits, over time.
BOQ’s NIM trajectory illustrates the pressure: 1.80% in 2H FY24, declining to 1.74% in 1H FY25, then to 1.67% in 1H FY26. Each step lower reflects the structural cost of funding that is more expensive to acquire and retain.
One portfolio manager described funding mix quality, the proportion of stable, low-cost deposits, as “the key qualitative differentiator” for bank valuations, but one that is often overlooked in retail P/E-based comparisons.
Beyond funding, three structural disadvantages explain why a regional trading at the same multiple as a major is not the same investment:
This is the first check investors should perform after running a P/E model: not whether the multiple looks cheap, but whether the bank’s funding base can sustain the earnings the multiple implies.
Every valuation model using trailing earnings implicitly assumes the macroeconomic conditions that produced those earnings will persist or improve. For BOQ, those conditions are specific and measurable.
| Macro indicator | Current reading | Directional trend | Implication for BOQ loan book |
|---|---|---|---|
| Unemployment rate | 4.5% (April 2026) | Rising (up from 4.3% in March 2026) | Credit quality broadly sound but tail risk increasing if softening continues |
| Household debt-to-disposable income | Approximately 186% (late 2025) | Broadly stable near historical highs | Amplifies credit risk if unemployment rises or rates stay elevated |
| National dwelling value growth | Approximately 7% annual; +0.6% in April 2026 | Positive but pace moderating; Brisbane and Perth strongest | Rising collateral values support mortgage security near term; affordability pressures create medium-term sensitivity |
According to the Australian Bureau of Statistics, the unemployment rate reached 4.5% in April 2026 (released 21 May 2026), up 0.2 percentage points from the prior month. The RBA’s Financial Stability Review (October 2025) observed that while most borrowers were coping with higher interest rates, a subset of highly indebted households had very low spare cashflow. Some borrowers had transitioned to interest-only terms or extended loan terms, a deterioration that may not yet appear in headline non-performing loan ratios.
BOQ’s geographic concentration in Queensland makes Brisbane property market conditions a bank-specific variable, not a generic national observation. Strong Brisbane dwelling values are a credit positive today, but a Queensland-specific shock, whether in construction, tourism, or broader employment, would be concentrated rather than diversified across the loan book.
The macro forces compressing bank earnings in 2026 are not specific to BOQ: the four major banks collectively allocated approximately $800 million in additional loan loss provisions during the most recent reporting season, and Morgan Stanley reversed a 4% sector earnings upgrade with an equivalent 4% downgrade within three months, a sequence that illustrates exactly how quickly macro conditions can invalidate trailing earnings assumptions.
Investors who have run a DDM or P/E model should stress-test their implicit macro assumptions with specific questions:
These are not abstract scenarios. They are the specific variables that determine whether trailing earnings are a reasonable proxy for future earnings, or whether they are already overstating the bank’s forward profitability.
The sensitivity of macro assumptions in bank valuation is not unique to BOQ: modest input changes to a NAB model can shift fair value estimates from $19.00 to $85.50, and the same household debt ratio of approximately 186% of disposable income that pressures BOQ’s Queensland loan book applies with equal force to every mortgage-heavy lender on the ASX.
Australian banks entered the Global Financial Crisis (GFC) in stronger shape than many offshore peers. Capital and underwriting standards were higher, and the sector avoided the worst of the structured-credit exposures that damaged European and American institutions. Post-GFC reforms under Basel III and the Australian Prudential Regulation Authority (APRA) further improved capital and liquidity buffers across the board.
That institutional strength, however, was not distributed evenly. Smaller banks remain structurally more exposed to funding shocks and confidence crises, even when headline capital ratios appear sound. In concentrated banking systems like Australia’s, academic research has identified that information asymmetries and lower analyst coverage make mispricing, both over- and under-valuation, more common for regionals than for major banks.
Three pre-GFC warning signs are now standard analytical checks for smaller bank exposures:
These qualitative signals rarely appear in a P/E or price-to-book multiple until the damage is already reflected in earnings.
The historical lesson is only useful if investors can check for these signals in practice. Each is observable in public disclosures.
LVR data appears in a bank’s Pillar 3 disclosures and half-year results presentations, typically broken down by loan-to-valuation band. NIM trend data should be read alongside volume growth commentary: if a bank reports strong loan growth in the same period that NIM compresses, the combination warrants closer scrutiny. Results presentations and analyst Q&A transcripts often contain the most candid management commentary on whether growth is being pursued at the expense of margin discipline.
Post-GFC reforms have improved the baseline, and current housing lending serviceability buffers are tighter than they were before the crisis. Household indebtedness, however, is materially higher now. The lesson is not that a crisis is imminent. The lesson is that a bank can appear cheap on P/E or price-to-book and still carry structural fragility that the multiple cannot capture.
BOQ is in the early months of a leadership transition. Patrick Allaway retired as Executive Chair and CEO on 28 February 2026. Rod Finch, previously Chief Transformation and Operations Officer, was appointed CEO and Managing Director effective 1 March 2026. This was an internal appointment, and detailed public commentary on Finch’s strategic priorities remains limited as of May 2026.
A leadership transition at any company introduces uncertainty. At a regional bank under regulatory scrutiny, the stakes are higher.
In October 2023, APRA announced an additional operational risk capital requirement for BOQ, citing weaknesses in operational risk, compliance, and risk management frameworks. APRA stated the capital overlay would remain until BOQ remedied the identified deficiencies. That overlay directly constrains how much capital the bank can deploy toward growth and dividends. As of May 2026, there is no confirmed public statement explicitly addressing whether this overlay has been reduced or lifted.
APRA’s court-enforceable undertaking with BOQ, announced in May 2023, imposed a $50 million operational risk capital add-on and set formal conditions around remediation of risk management, compliance, and governance frameworks, with the overlay remaining in place until APRA determines those deficiencies have been adequately addressed.
Regulatory standing and management execution quality are qualitative inputs that a DDM or P/E multiple cannot price. They determine whether the earnings and dividends the model assumes are achievable.
BOQ’s cash return on equity (ROE) stood at 7.2% in 1H FY25, well below major bank levels, reflecting elevated costs from technology remediation and risk uplift programmes. Whether Finch’s leadership can accelerate the cost-out trajectory while maintaining risk discipline is a question the numbers cannot yet answer.
Investors evaluating BOQ should complete four specific checks in this category:
A single data point is a snapshot. A trend is a story. BOQ’s profitability metrics across three consecutive half-year periods tell a story of persistent compression that investors need to weigh against their model assumptions.
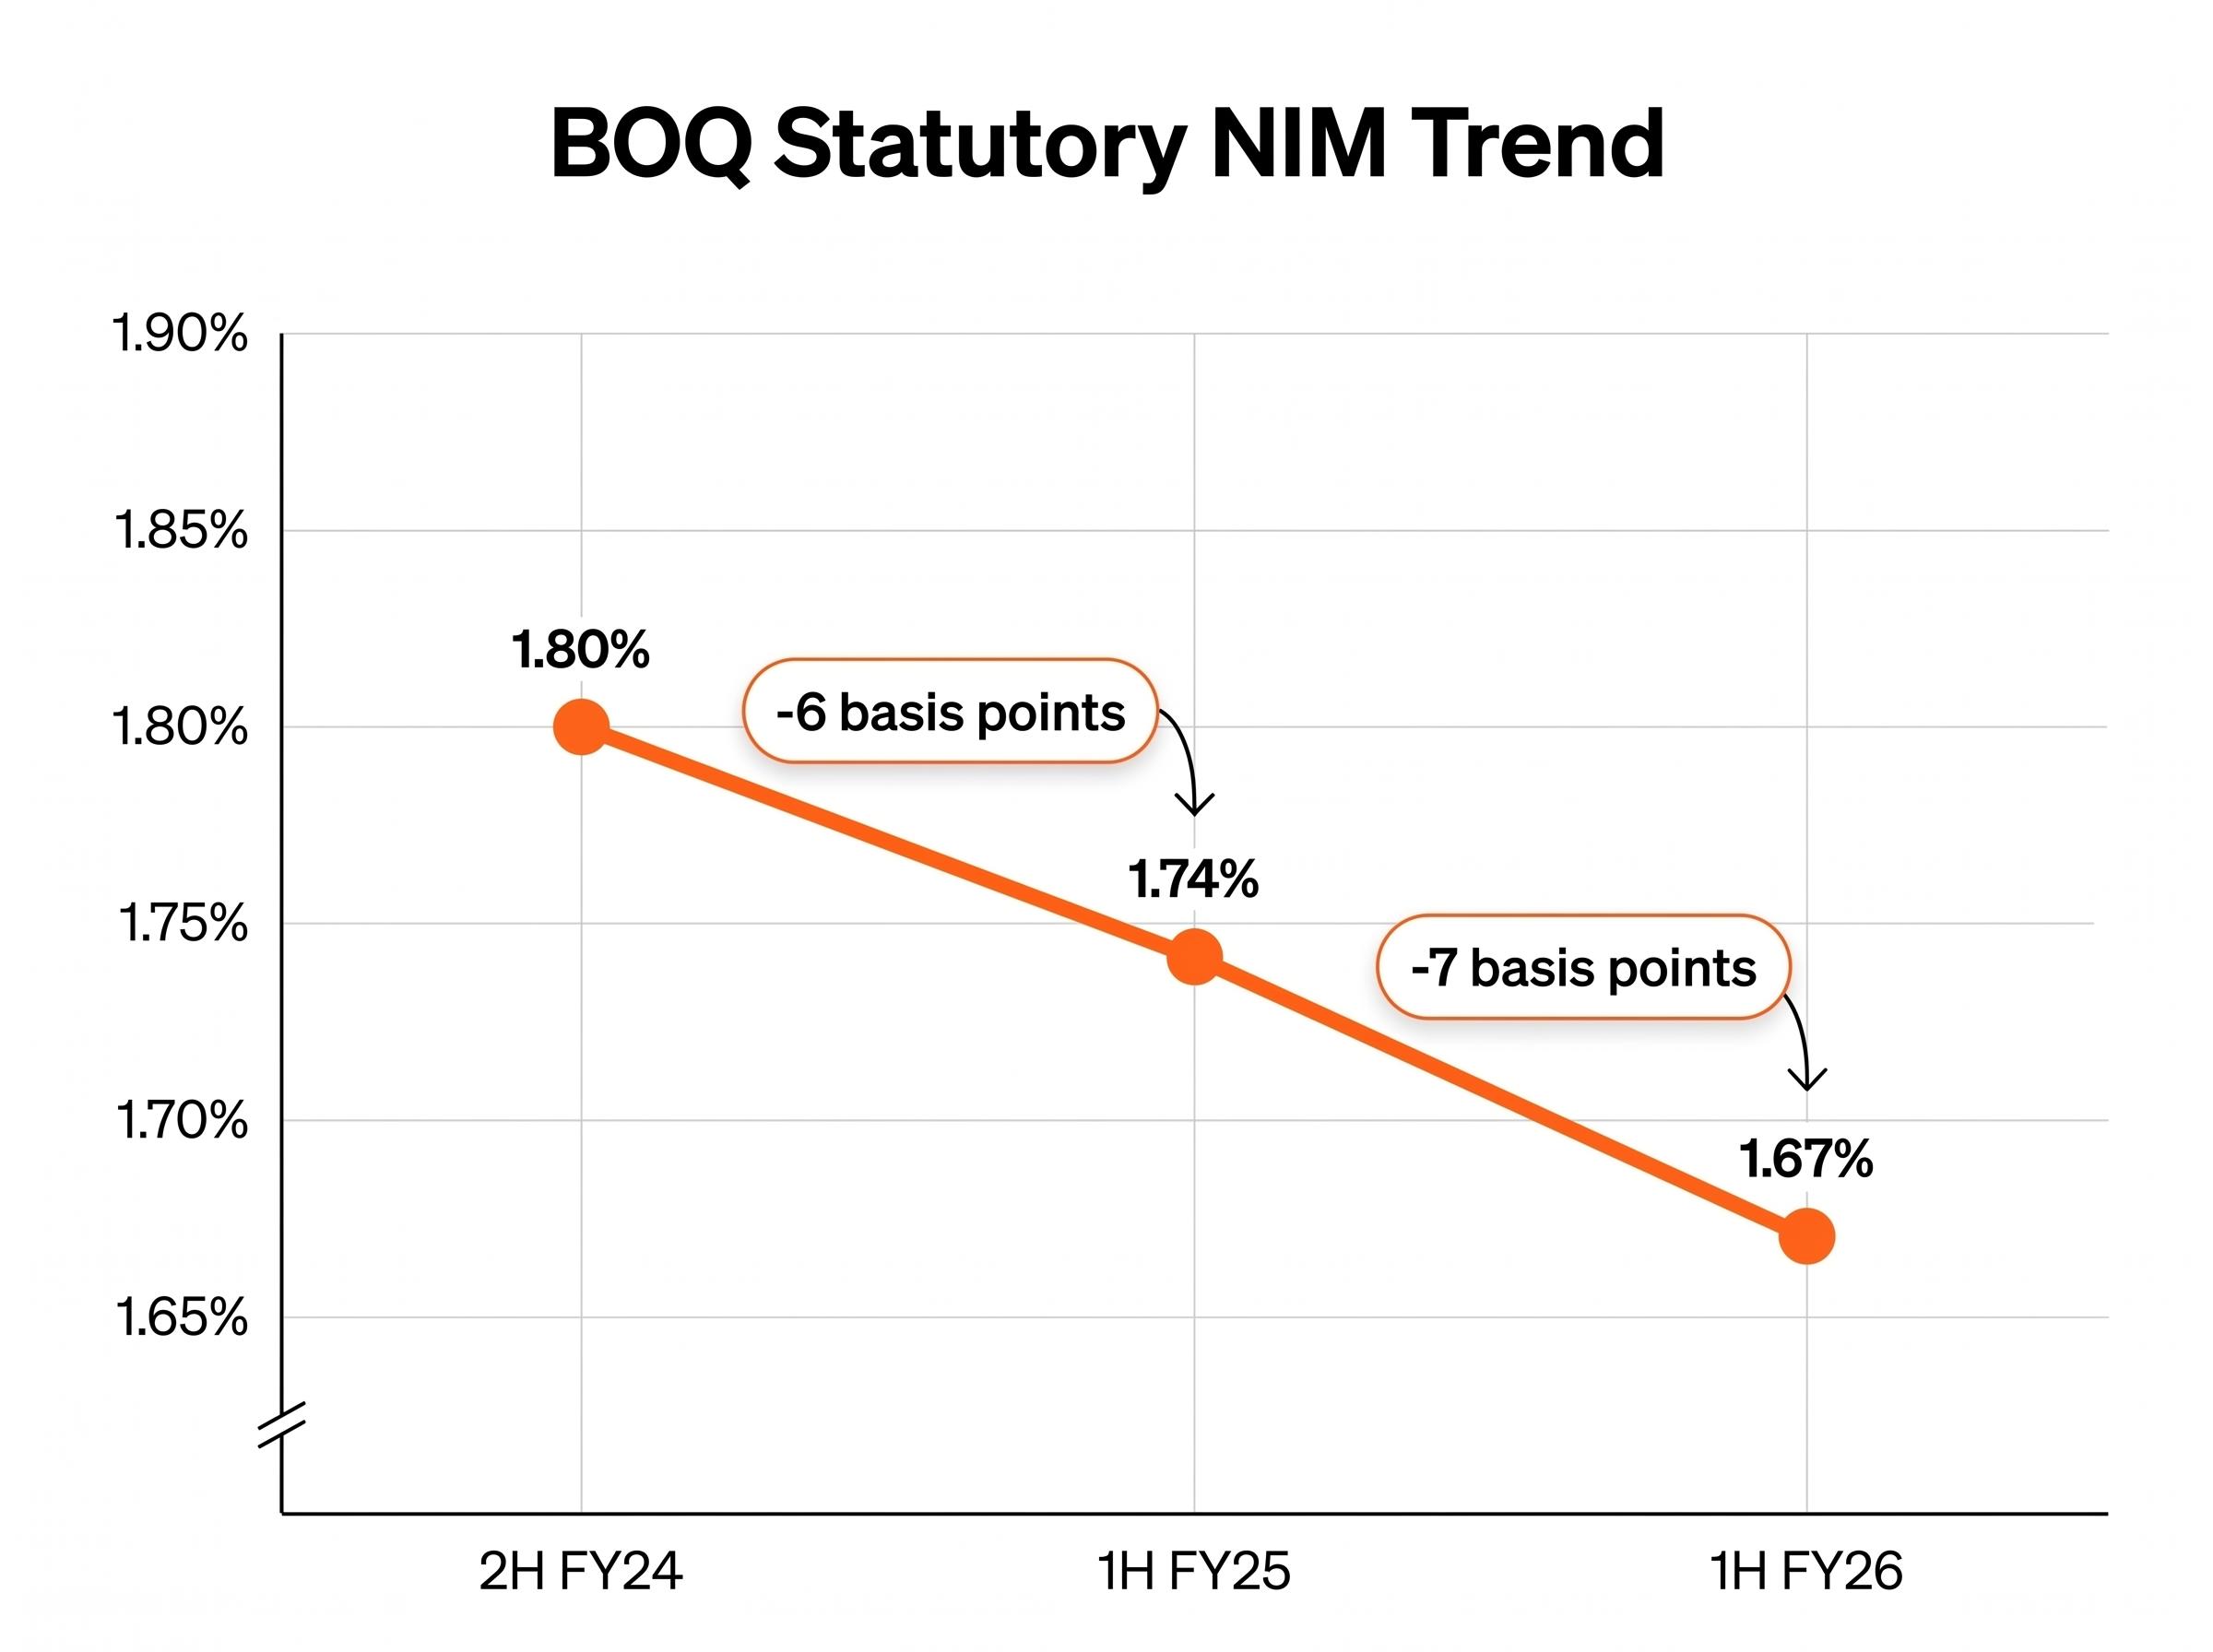
| Period | Statutory NIM | Change from prior period | Signal for dividend sustainability |
|---|---|---|---|
| 2H FY24 | 1.80% | Baseline | Margin provides some earnings buffer |
| 1H FY25 | 1.74% | -6 basis points | Compression underway; earnings growth depends on volume or cost offsets |
| 1H FY26 | 1.67% | -7 basis points | Compression accelerating; dividend payout ratio sustainability under pressure without cost improvement |
The drivers behind this compression are not cyclical. Funding cost competition, term deposit pricing pressure from both major and non-bank competitors, and mortgage pricing wars in prime segments are structural forces that a regional bank with BOQ’s funding mix cannot easily escape.
The cost-to-income ratio adds a second dimension to the pressure. BOQ reported 59.5% in 1H FY25, with management’s medium-term target set at the mid-50s. The gap between current performance and target is substantial, and investors should assess whether the cost-out programme has clearly defined milestones or whether the target functions more as an aspiration than a plan.
A DDM using a $0.35 forward dividend implicitly assumes that earnings and payout ratio remain stable enough to sustain that payment. The sensitivity range on the DDM illustrates how fragile that assumption is: the central estimate sits at $7.19-$7.40 using the cash dividend, but the full range stretches from $3.89 to $17.50 depending on the growth rate and discount rate assumptions applied.
Three questions investors should ask when reviewing a DDM output against BOQ’s profitability trend:
Investors wanting to go deeper on the quantitative metrics that sit alongside the qualitative checklist in this article will find our full explainer on regional bank stock analysis covers ROE, NIM, CET1 capital adequacy, workplace culture scores, and a DDM valuation framework, each benchmarked against BOQ’s actual reported figures and sector averages.
Past performance does not guarantee future results. Financial projections are subject to market conditions and various risk factors.
This guide has covered five qualitative and macroeconomic layers that sit between a model output and an informed investment decision: the structural funding disadvantages that explain BOQ’s persistent valuation discount; the specific macro and property market variables that determine loan book quality; the historical warning patterns that professional credit analysts check for in smaller banks; the management transition and regulatory standing that constrain strategic flexibility; and the profitability trend that either supports or undermines the assumptions embedded in any DDM or P/E calculation.
The DDM range of $3.89 to $17.50 is not a flaw in the model. It is the model honestly expressing that the outcome depends entirely on qualitative assumptions about the bank’s future trajectory.
Three items require current verification before any position decision:
This article is for informational purposes only and should not be considered financial advice. Investors should conduct their own research and consult with financial professionals before making investment decisions.
BOQ share valuation is typically estimated using P/E multiples, dividend discount models, and price-to-book ratios, but BOQ trades at a persistent discount to major banks because of structural disadvantages including greater reliance on expensive term deposit and wholesale funding, smaller scale, and disproportionate compliance costs relative to revenue.
In October 2023, APRA imposed an additional operational risk capital requirement on BOQ, citing weaknesses in risk management, compliance, and governance frameworks; this overlay constrains how much capital BOQ can deploy toward growth and dividends, and investors should verify its current status in the latest Pillar 3 disclosure before acting on any valuation model.
BOQ's statutory NIM declined from 1.80% in 2H FY24 to 1.74% in 1H FY25 and further to 1.67% in 1H FY26, a compression driven by structural funding cost pressures; this ongoing squeeze puts the dividend payout ratio under increasing strain unless the bank can deliver meaningful cost reductions.
Investors should examine the impact of rising unemployment (which reached 4.5% in April 2026), household debt at approximately 186% of disposable income, and Brisbane property values, since BOQ's geographic concentration in Queensland means a regional economic shock would be concentrated rather than diversified across its loan book.
Investors should verify the current APRA overlay status in BOQ's latest Pillar 3 disclosure, review CEO Rod Finch's strategic priorities from the 1H FY26 results transcript, and update any model using older data with the full set of current ROE, cost-to-income, and impairment figures from the most recent ASX results release.