
Citi Names 7 China Data Centre Stocks as AI Buildout Accelerates
20 mins ago

National Australia Bank shares are trading near a 52-week low of A$35.48, roughly 28% below their peak of A$49.45, and the analyst community cannot agree on what that means. UBS has a buy rating with a A$48.50 price target, implying a total return of approximately 40% when dividends are included. Ord Minnett sits at A$37.00 with a hold. MPC Markets recommends reducing exposure entirely. For a stock held directly or indirectly by millions of Australian investors through superannuation and retail portfolios, a spread that wide on one of the country’s four largest banks is not academic. It is the central question facing anyone with NAB exposure in June 2026. What follows maps the bull case, the bear case, and the contested middle ground with enough specificity that readers can identify which camp’s assumptions align most closely with their own view of the macro environment and NAB’s earnings trajectory, and calibrate accordingly.
The decline from A$49.45 to A$35.48 represents an approximately 28% drawdown, a move that stands out for a stock with a beta of roughly 0.72. NAB typically moves less than the broader market. A drawdown of this magnitude in a low-volatility name signals that something beyond normal cyclical rotation is being priced in.
A 28% peak-to-trough decline in a stock that historically moves at 72% of the market’s volatility. The drawdown is not normal for this franchise.
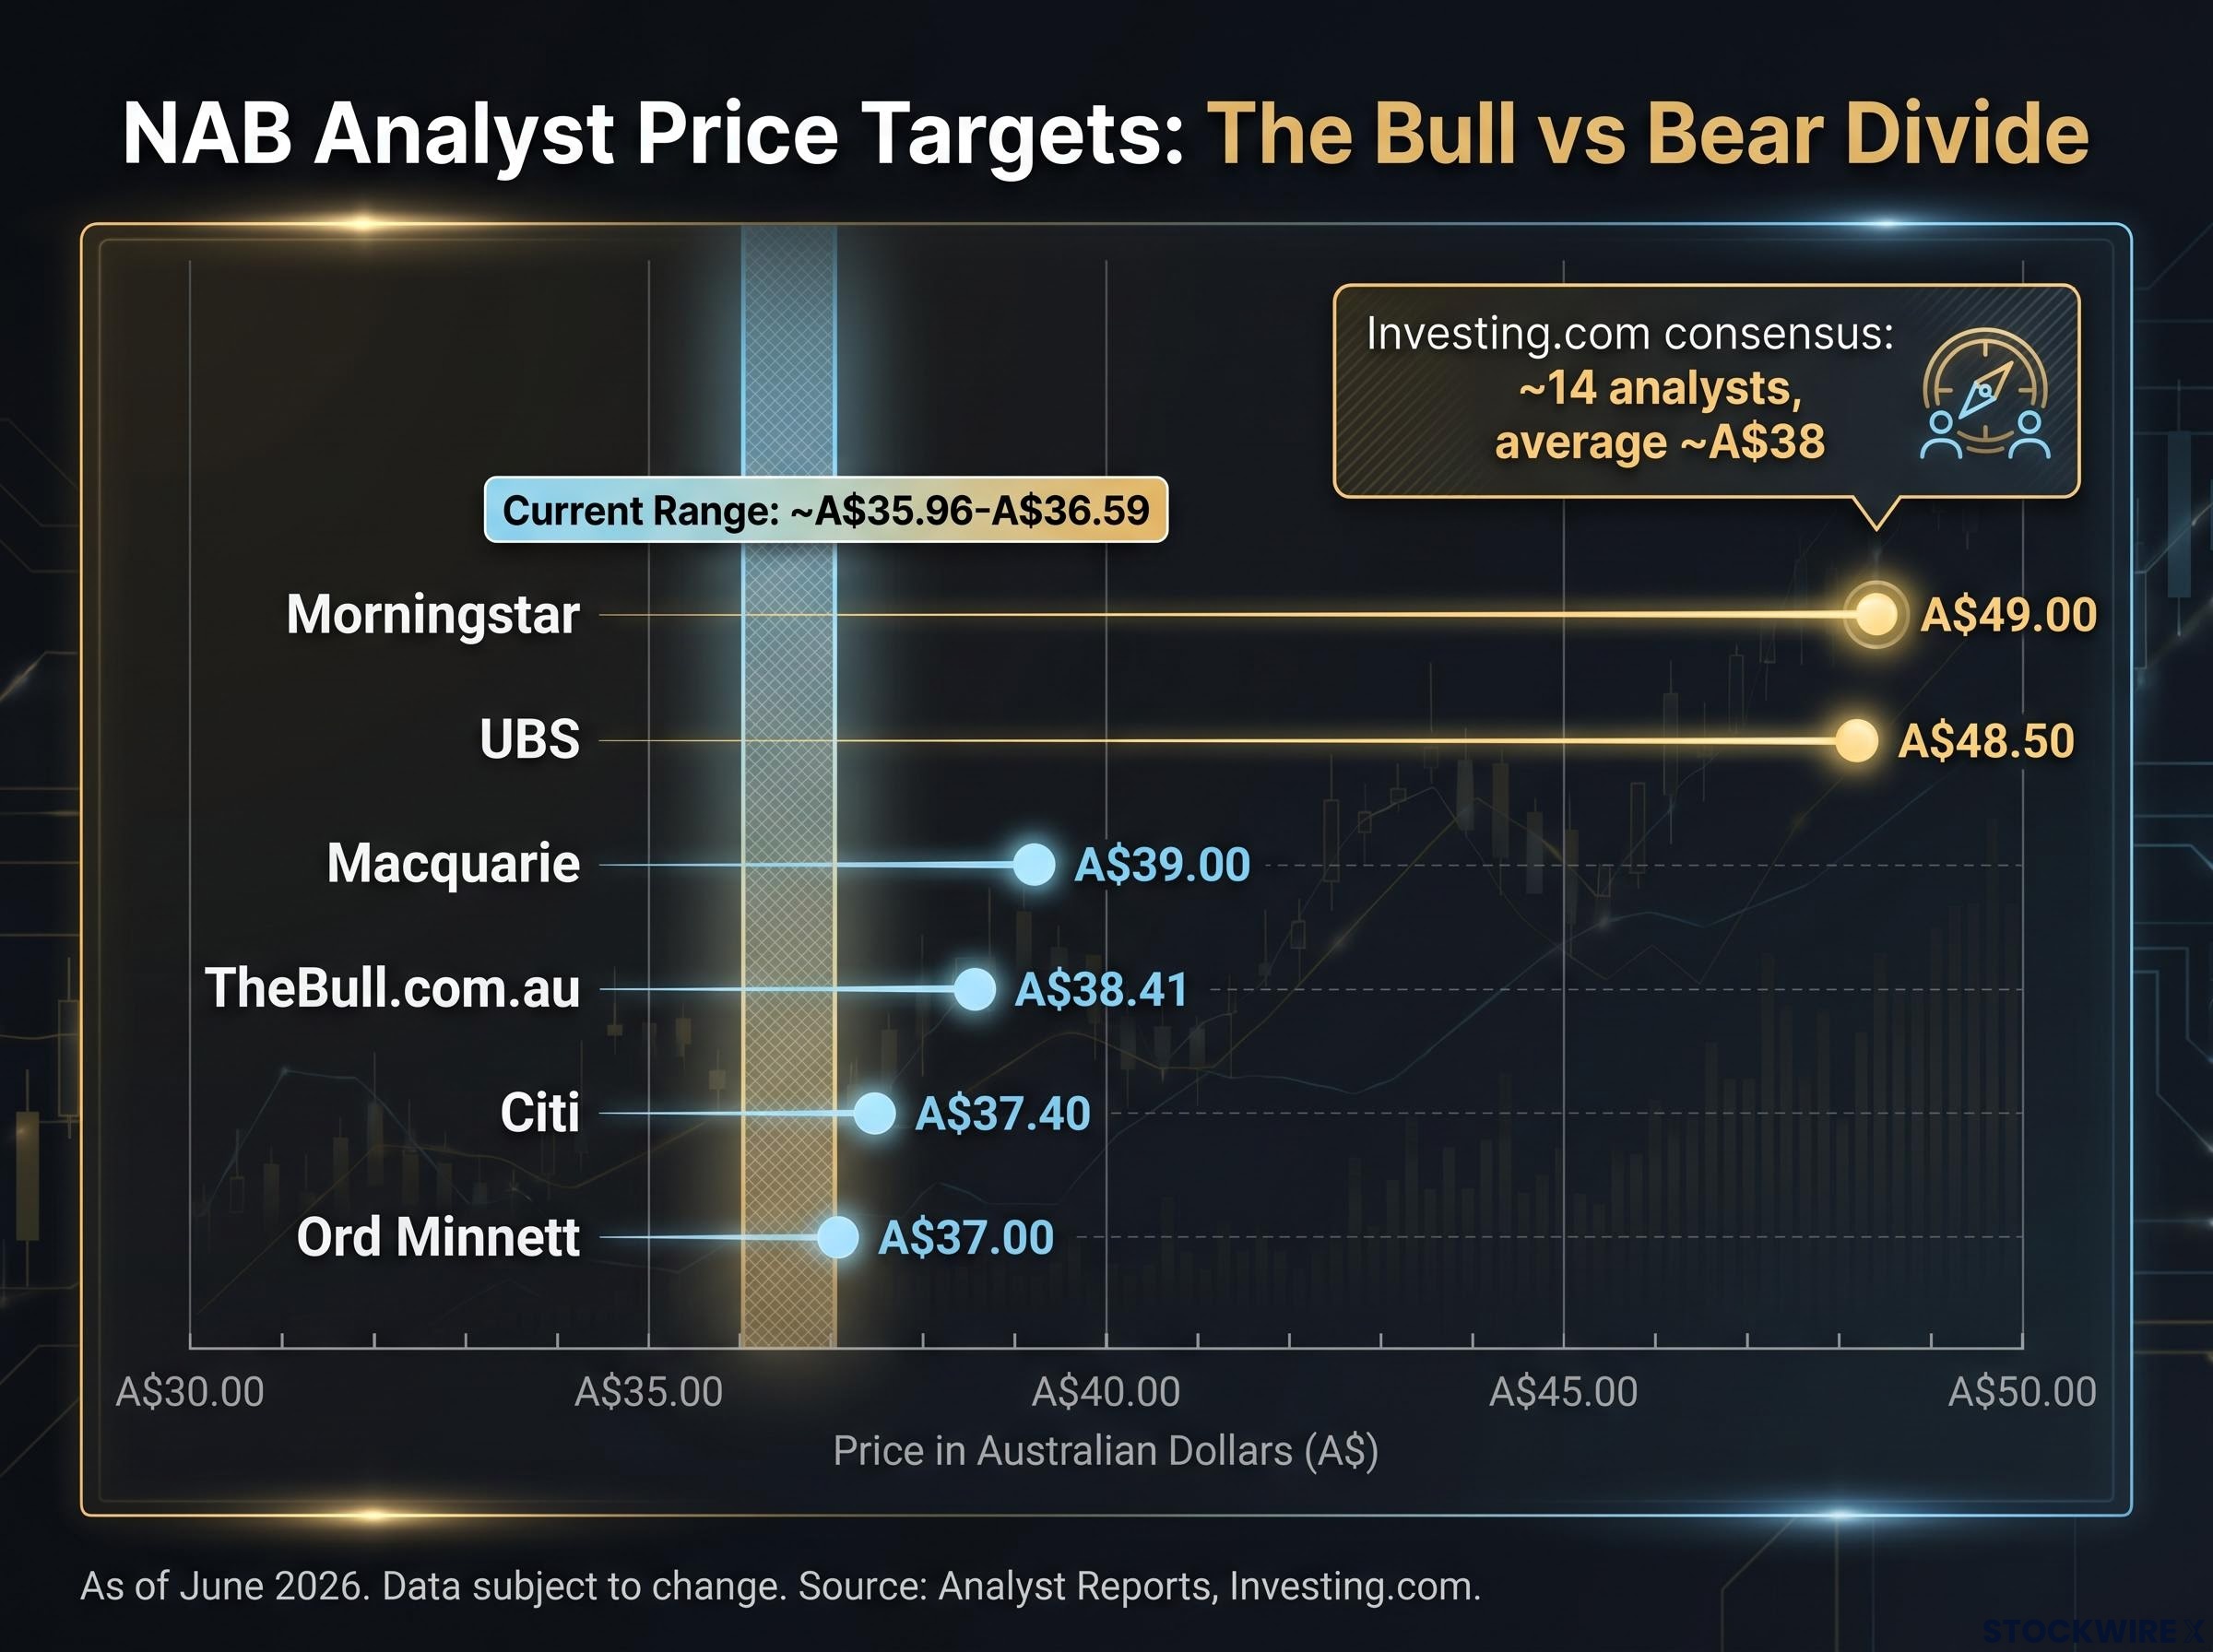
As of early June 2026, NAB trades in the range of approximately A$35.96-A$36.59. The valuation metrics at these levels set up the core tension that divides the analyst community.
| Metric | Value |
|---|---|
| Current price range | A$35.96-A$36.59 |
| 52-week high | A$49.45 |
| 52-week low | A$35.48 |
| P/E ratio | ~18-20 |
| Dividend yield (fully franked) | ~4.6-4.8% |
| Market capitalisation | ~A$110-113 billion |
| Beta | ~0.72 |
A P/E of 18-20 is not distressed territory. That detail matters. It means bulls and bears are not arguing about whether NAB is broken; they are arguing about whether the current earnings trajectory supports the multiple, or whether the multiple needs to compress further.
The share price decline has fundamental grounding. NAB’s H1 FY2026 net profit fell short of analyst forecasts, weighed down by rising bad debt provisions and one-off charges. The miss was not catastrophic in isolation, but it arrived in a context that amplified its effect: a mature rate cycle already squeezing margins across the sector, and investor sentiment already cooling toward bank earnings durability.
NAB’s H1 2026 result produced a near-3% single-day share price fall even as underlying profit grew 6.4%, a reaction that becomes legible only when the ROE, NIM, and CET1 figures beneath the headline are read against what the market had already priced in.
Three specific headwinds dominated analyst commentary in the wake of the result:
These three factors are precisely where the bull and bear camps diverge. The bull side argues they are cyclical, temporary, and already priced into the stock at these levels. The bear side argues they have further to run.
The headwinds facing NAB are not idiosyncratic. Net interest margin compression and rising provisions are a sector-wide dynamic affecting all major Australian banks. That context does not dismiss NAB’s underperformance, but it does mean the drawdown reflects macro conditions as much as company-specific execution. NAB’s profit margin remains close to 30%, providing some buffer, though the direction of travel is what concerns the cautious camp.
APRA quarterly ADI statistics for December 2025 corroborate the sector-wide nature of these pressures, showing deteriorating credit quality metrics and capital adequacy trends across authorised deposit-taking institutions, with the regulator activating debt-to-income limits in February 2026 in response to rising household credit stress.
Bank stocks are valued differently from growth stocks. The metrics that matter most are price-to-earnings, price-to-book, and dividend yield, not revenue growth multiples. What constitutes “cheap” for a major bank depends entirely on the earnings trajectory underpinning the multiple.
Bank stock valuation metrics such as net interest margin, return on equity, and the CET1 capital ratio carry more diagnostic weight than a P/E ratio alone, because they reveal whether the earnings generating the multiple are being produced from pricing power, capital efficiency, or balance sheet leverage.
A P/E of 18-20 is the crux of the current debate. At face value, it does not suggest distress. But if earnings slip, the multiple mechanically expands (the denominator shrinks), making the stock appear more expensive rather than cheaper. Bulls need earnings to hold steady or recover. Bears argue the H1 miss is the first signal of a downward trend that has not yet been fully reflected.
The consensus analyst cluster supports this tension. Most broker targets land in the high-A$30s to low-A$40s, implying modest upside at best. Morningstar’s fair value of A$49 and UBS’s target of A$48.50 sit well above that cluster.
The variable that connects the two camps is return on equity (ROE), the measure of how efficiently a bank generates profit from shareholder capital. If NAB’s ROE holds up at or near historical levels, the higher targets become defensible: the franchise is generating returns that justify a premium valuation. If ROE trends down under margin and provision pressure, the more cautious A$37-A$39 cluster is the more realistic anchor.
If NAB sustains its returns on equity, targets near A$49 are defensible. If they erode, the A$37-A$39 cluster is more likely correct.
Some datasets flag a PEG ratio above 2, suggesting growth may not be rapid enough to support even the current multiple, though this figure is unverified and should be treated with caution.
The divide across the analyst community is not random. Each position maps onto a specific assumption about NAB’s earnings trajectory, macro duration, and ROE sustainability. The following table summarises the named positions and their implied upside from approximately A$36.
| Analyst / Source | Rating | Price Target | Implied Upside from ~A$36 |
|---|---|---|---|
| UBS | Buy | A$48.50 | ~35% |
| Morningstar | Fair value | A$49.00 | ~36% |
| Macquarie | Neutral | A$39.00 | ~8% |
| TheBull.com.au | Mild upside | A$38.41 | ~5% |
| Citi | Neutral | A$37.40 | ~4% |
| Ord Minnett | Hold | A$37.00 | ~3% |
| MPC Markets | Reduce | N/A | Negative |
The UBS buy case deserves a fair hearing. Issued approximately one month before June 2026, it implies roughly 35% capital upside from the 52-week low. Pair that with a fully franked dividend yield of approximately 4.8%, and the total return potential reaches approximately 40%.
UBS’s total return case: approximately 40%, combining a A$48.50 price target with a 4.8% fully franked yield.
That said, UBS represents the minority camp. The Investing.com consensus across approximately 14 analysts shows an average target of roughly A$38, with approximately 2 buys, 7 holds, and 5 sells. The neutral-to-cautious cluster, Macquarie at A$39, Citi at A$37.40, and Ord Minnett at A$37, effectively amounts to a hold-and-collect-yield position, implying very limited capital appreciation.
MPC Markets sits at the opposite end. Its reduce recommendation is the clearest bear call: cut exposure, reallocate toward higher-growth opportunities, and accept that earnings momentum may not recover fast enough to prevent further valuation erosion.
The analyst landscape is useful for orientation. The more actionable question is which set of assumptions matches a given investor’s situation. Four profiles emerge from the data:
The grossed-up dividend value for NAB’s approximately A$1.70 fully franked distribution reaches around A$2.43 per share once the attached franking credit is included, a figure that is materially different from the face cash yield and particularly significant for SMSFs in pension phase, where the credit can be claimed as a full cash refund from the ATO.
The analyst spread will narrow when new information arrives. Three items deserve a place on the watchlist:
The divide between the A$37 camp and the A$49 camp cannot be resolved by argument alone. It will be resolved by data.
NAB shares are not obviously cheap, nor are they obviously a trap. The A$37-A$49 range across analyst targets represents genuinely different interpretations of the same franchise, not different readings of different data. The outcome hinges on variables that remain unresolved as of June 2026: the trajectory of NAB’s earnings, the duration of macro headwinds, and whether returns on equity hold up or erode under margin and provision pressure.
For readers wanting to understand why two analysts can look at the same NAB balance sheet and arrive at targets 30% apart, our dedicated explainer on macro assumptions in bank valuation shows how the same dividend discount model produces a range from A$19.00 to A$85.50 per share depending solely on the growth and discount rate inputs, using NAB as the live case study.
The most defensible near-term position may be the income case. The fully franked yield is real, the franchise is sound, and downside from current levels may be limited even if the bull case takes longer than 12 months to materialise. The beta of 0.72 is a closing reminder: this is not a high-volatility stock, which makes a 28% drawdown notable rather than routine.
The question readers should hold as their analytical lens going forward is specific: does the H2 FY2026 result show that the earnings floor has been found?
This article is for informational purposes only and should not be considered financial advice. Investors should conduct their own research and consult with financial professionals before making investment decisions. Past performance does not guarantee future results. Financial projections are subject to market conditions and various risk factors.
NAB shares declined approximately 28% from their 52-week high of A$49.45 due to a combination of weaker-than-expected H1 FY2026 earnings, rising bad debt provisions, net interest margin compression from intense lending and deposit competition, and broader sector-wide credit quality pressures affecting all major Australian banks.
At current prices around A$36, NAB offers a fully franked dividend yield of approximately 4.6-4.8%, based on a projected annual dividend of around A$1.70 per share, with consensus forecasts projecting the dividend to be maintained through FY2026 and FY2027.
Analyst opinion is sharply divided: UBS holds a buy rating with a A$48.50 price target implying around 35% capital upside, while Macquarie is neutral at A$39, Citi and Ord Minnett cluster around A$37-A$37.40, and MPC Markets recommends reducing exposure entirely; the Investing.com consensus across roughly 14 analysts averages approximately A$38.
NAB's fully franked dividend of approximately A$1.70 per share grosses up to around A$2.43 once the attached franking credit is included, which is particularly valuable for SMSF investors in pension phase who can claim the franking credit as a full cash refund from the ATO.
The H2 FY2026 full-year result is the single most important near-term catalyst: if earnings and provisions stabilise or improve relative to the first half, the bull case gains credibility, while further deterioration would validate the cautious analyst consensus clustered around A$37-A$39.


