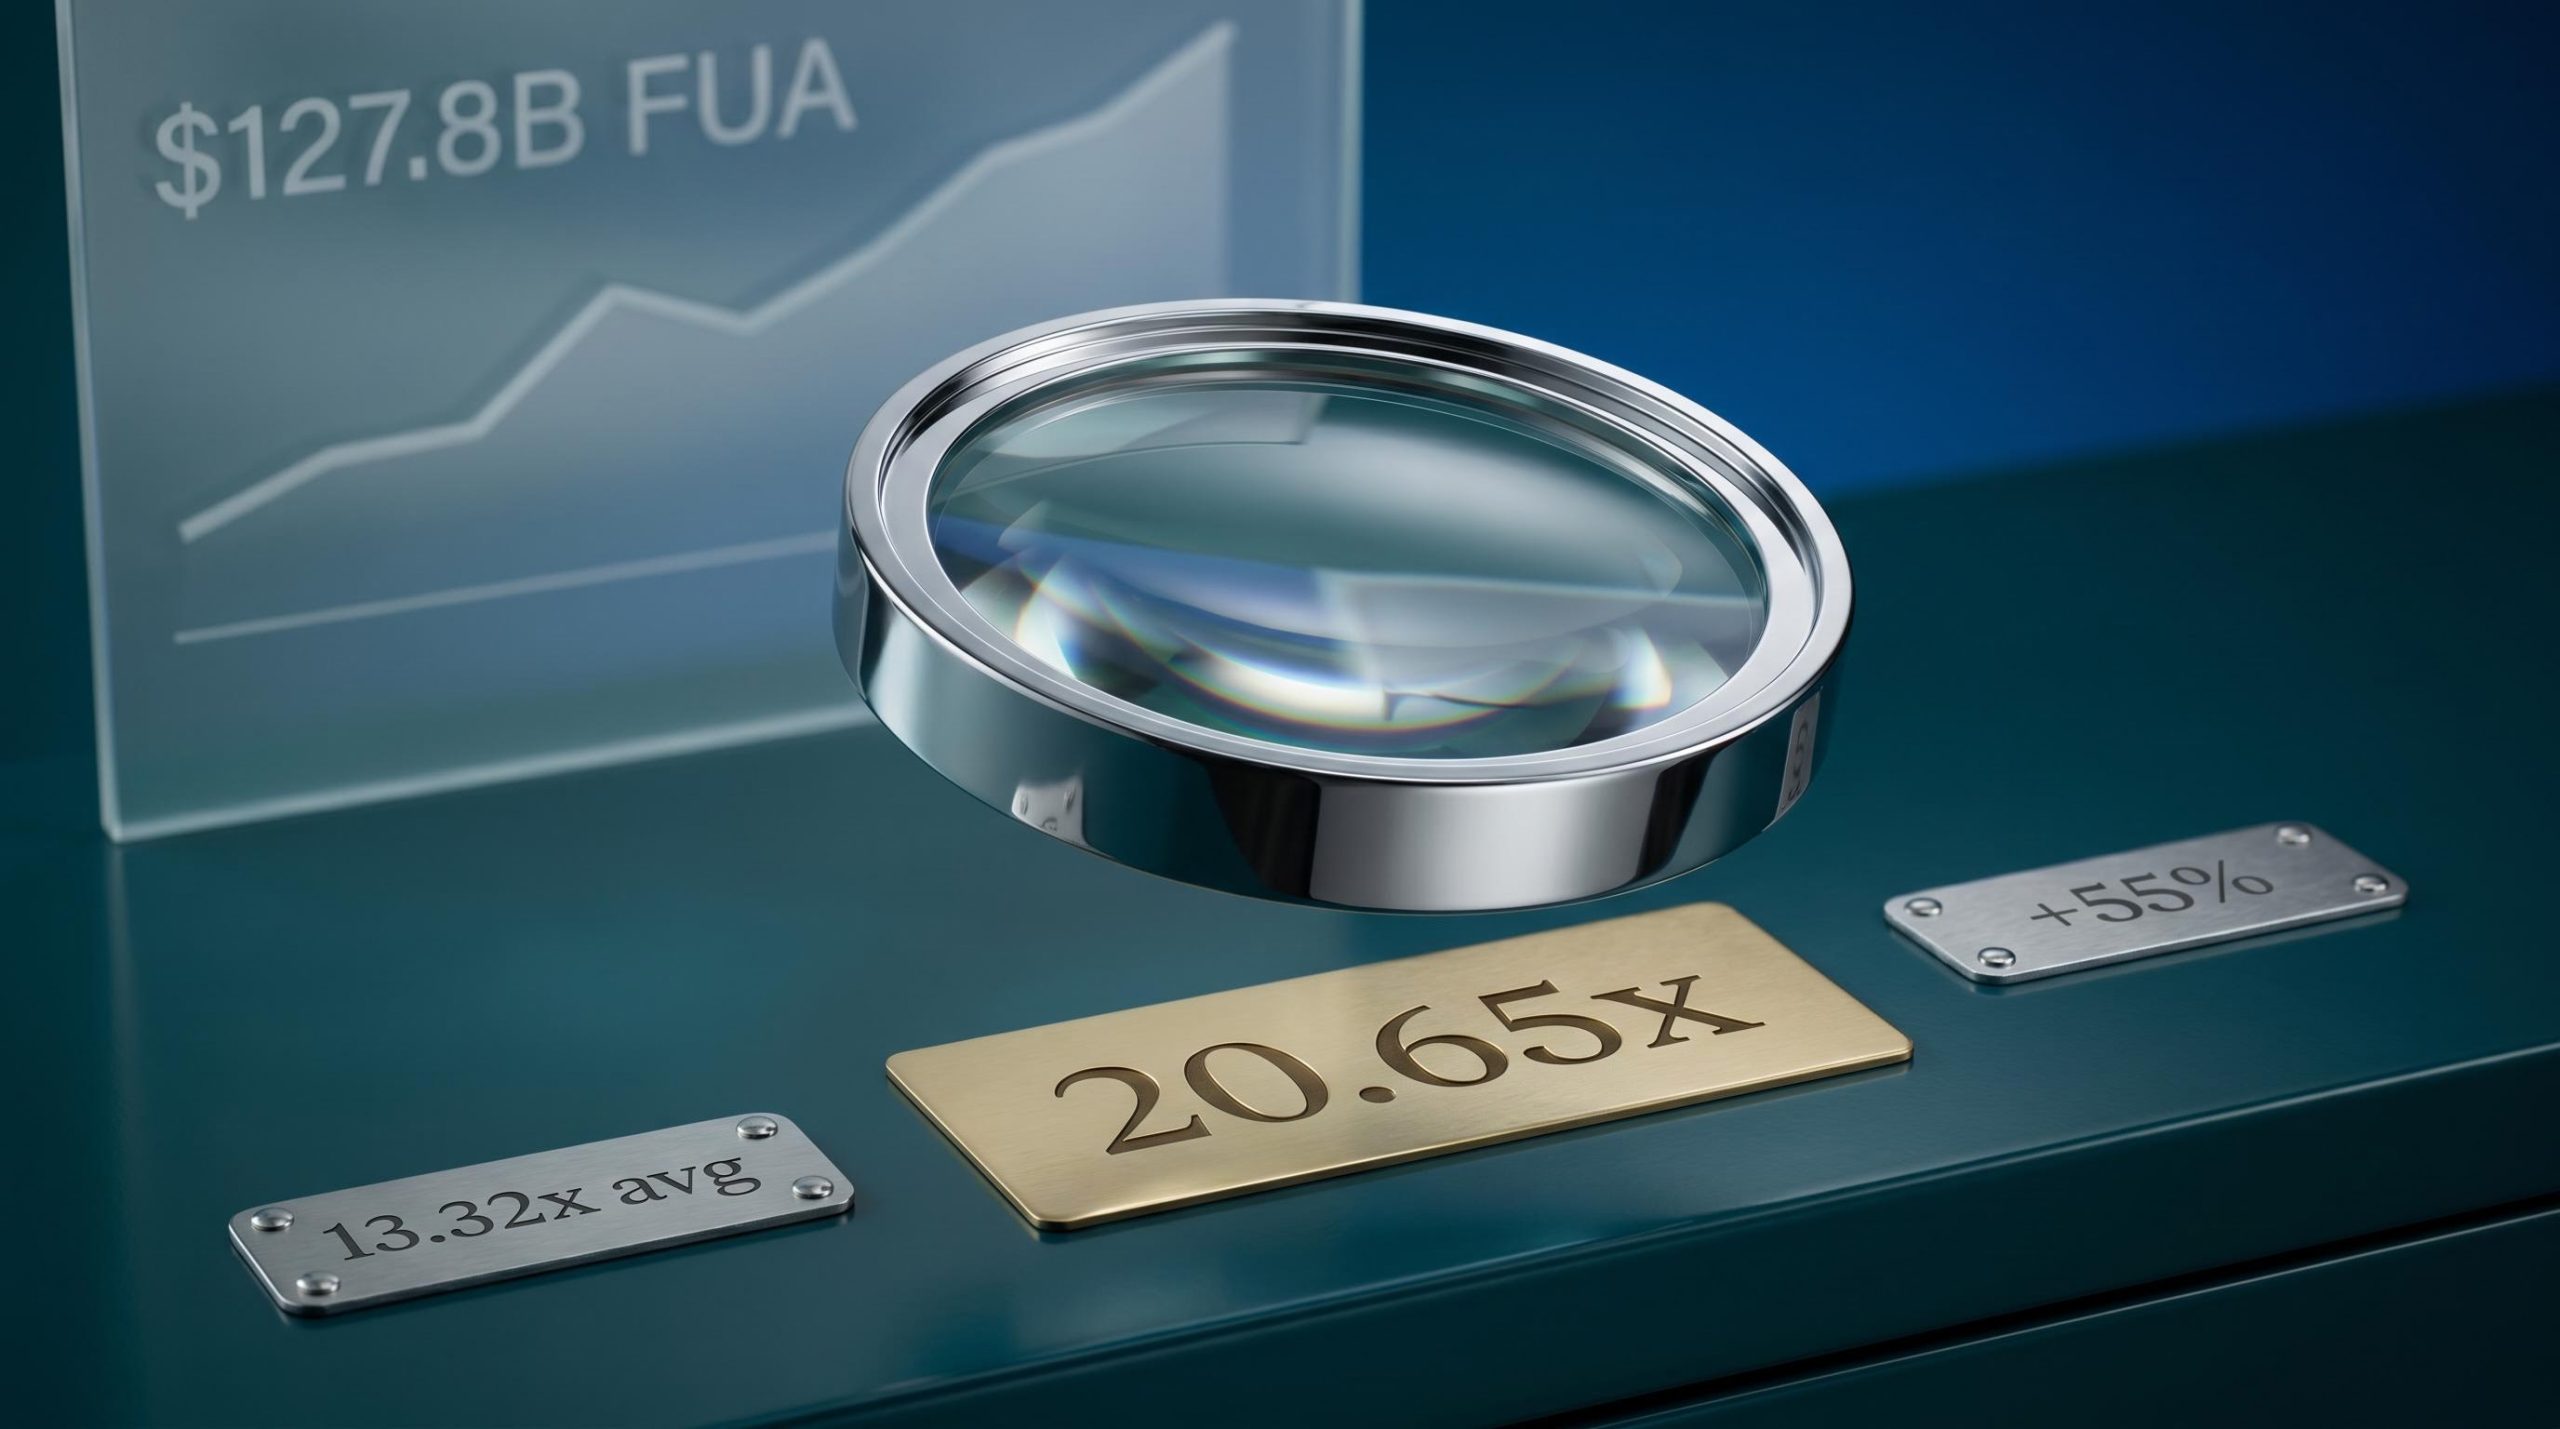
HUB24 Trades 55% Above Its P/S Average: Is the Premium Earned?
54 mins ago

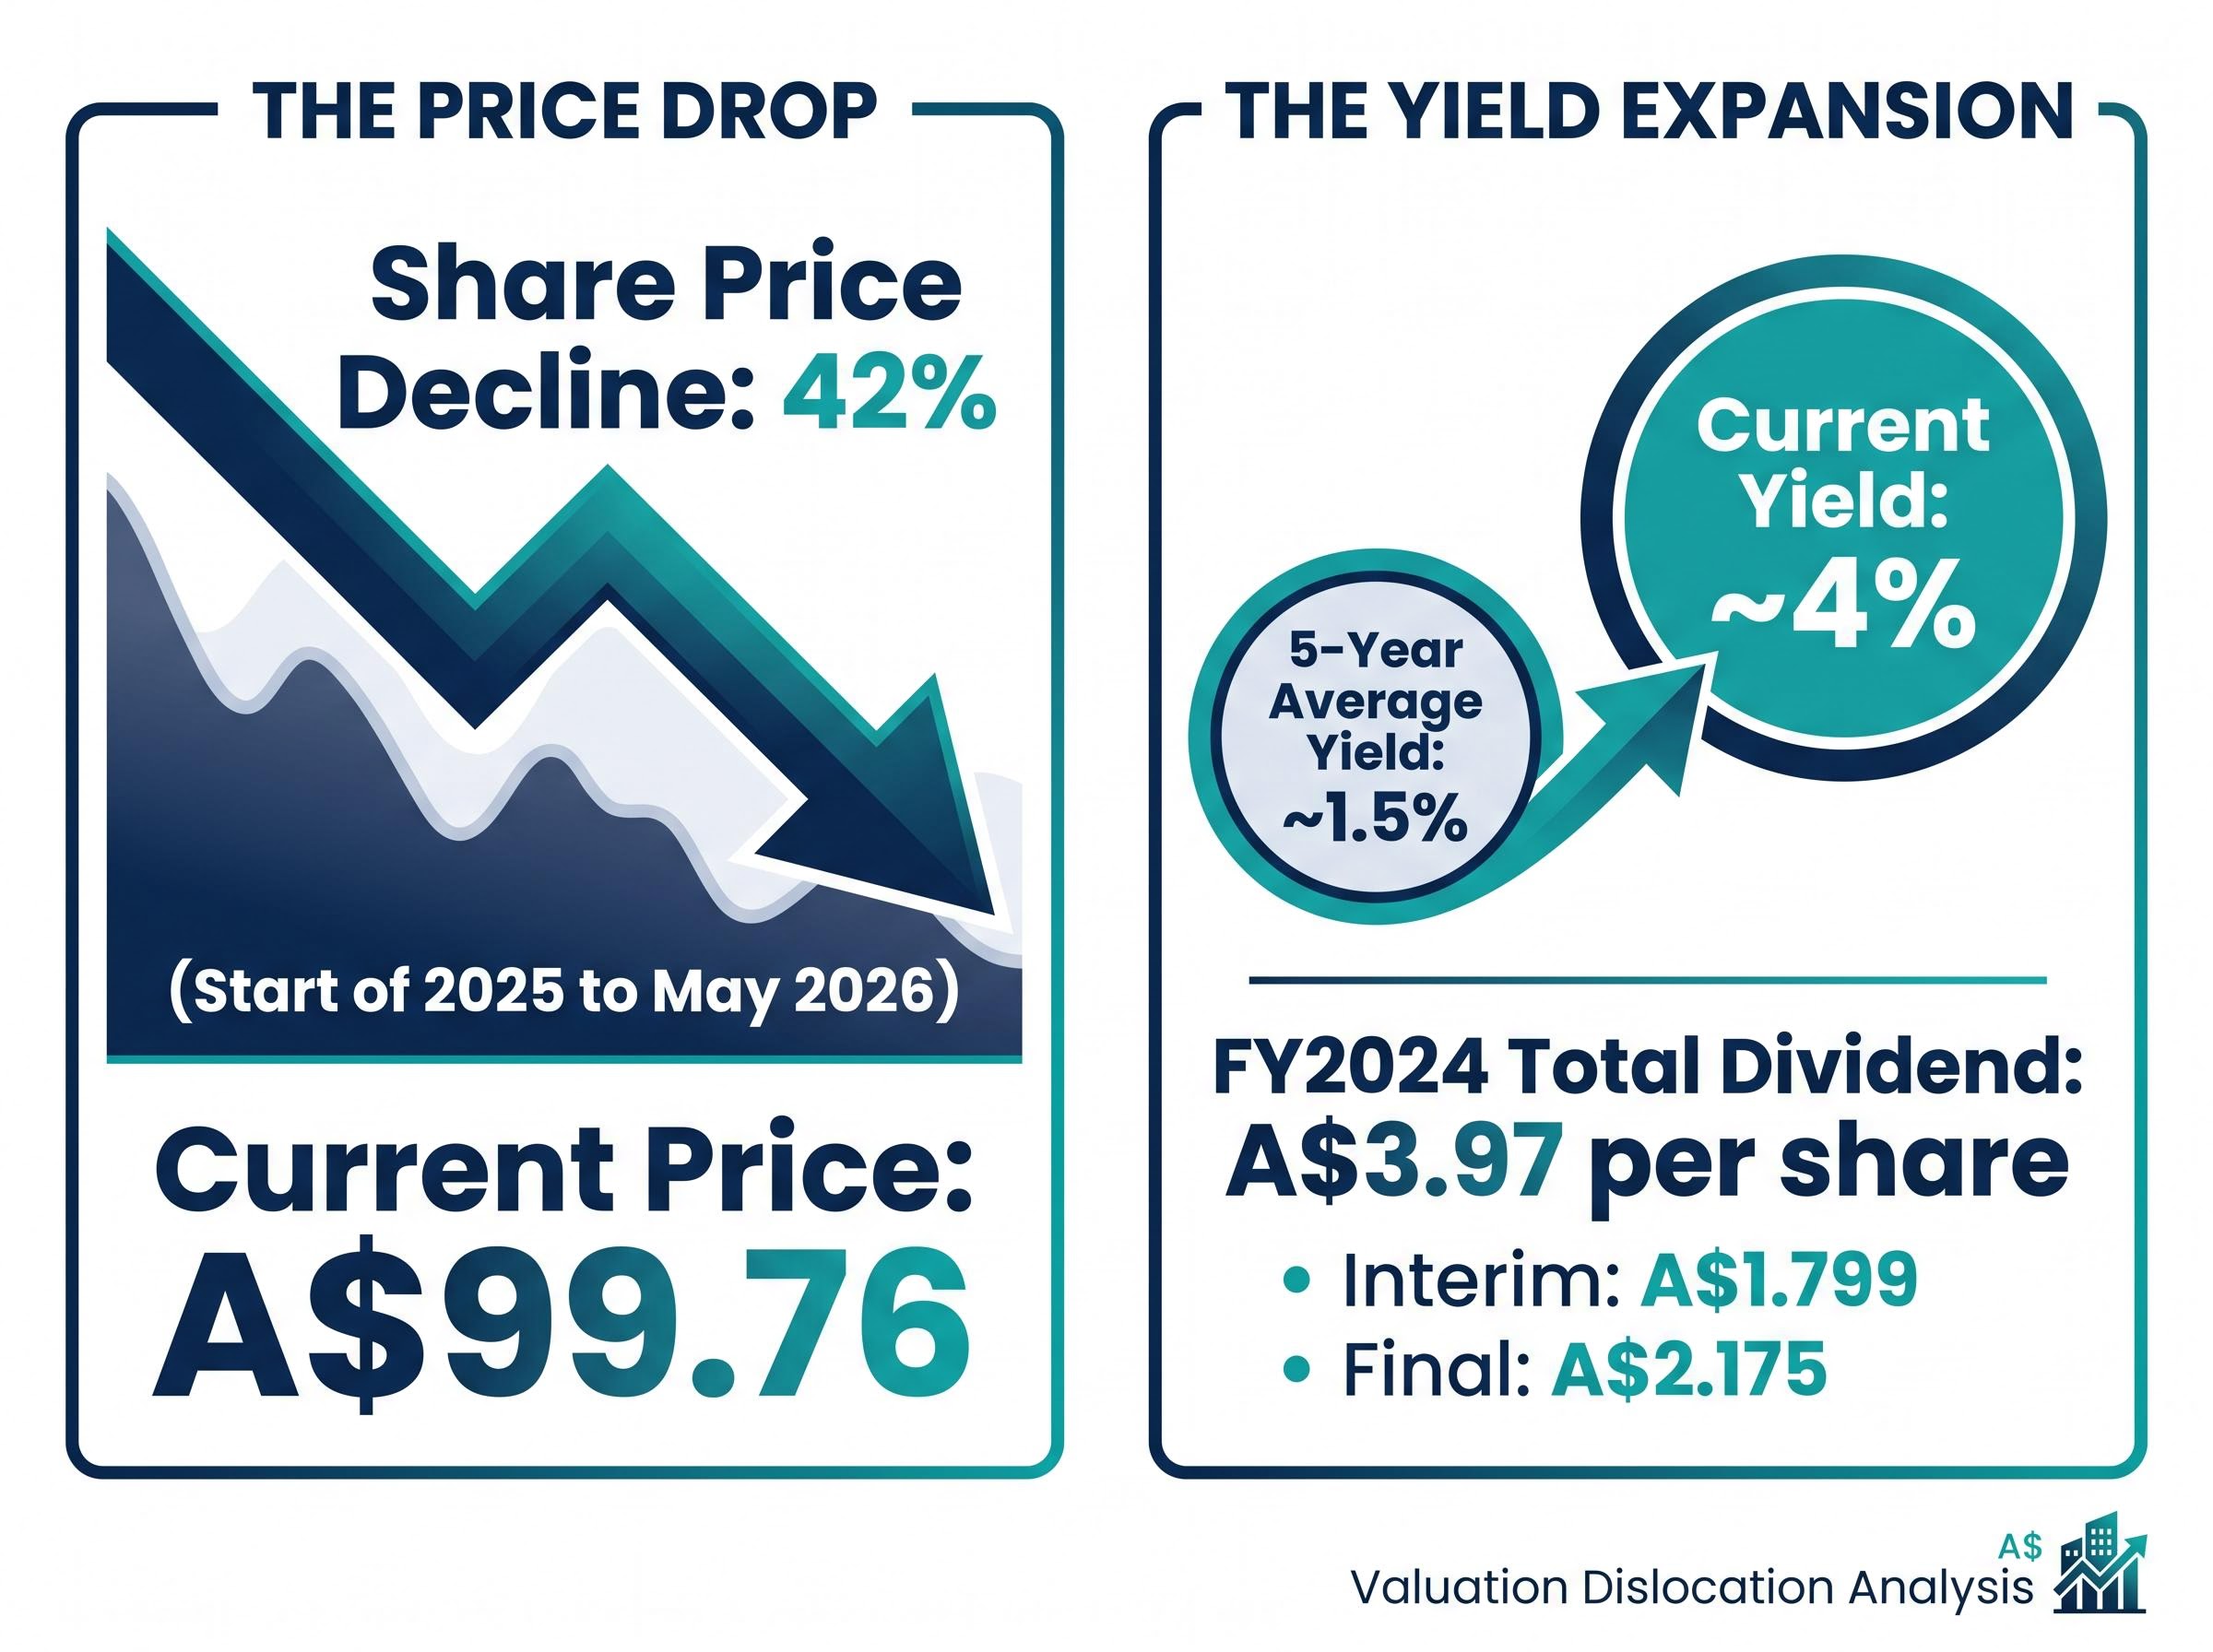
CSL Limited is trading at A$99.76, a price last seen years before the pandemic era lifted the stock into the stratosphere. The dividend yield, once a rounding error at roughly 1.5%, has climbed to nearly 4%. For Australian retail investors, this raises a pointed question: is this signal, or noise?
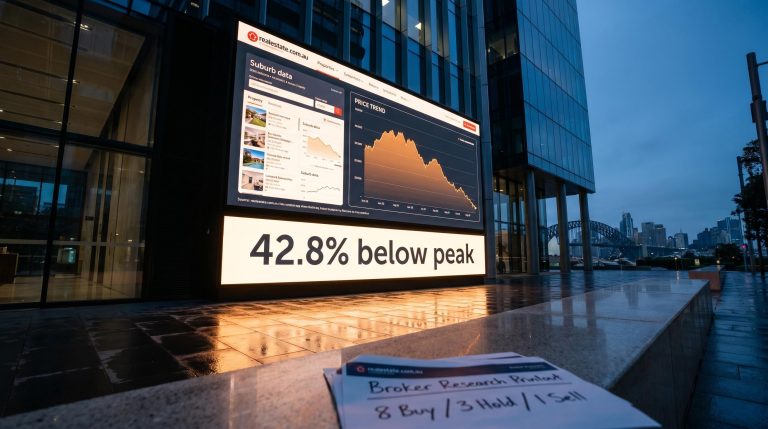
A 42% share-price decline from the start of 2025 through to May 2026 has made CSL one of the most-discussed valuation questions on the ASX. The decline has triggered a visible yield dislocation relative to historical norms, compressed price-to-earnings multiples, and invited comparisons to prior buying opportunities in the stock’s history. What follows works through what the dividend yield signal actually means for CSL’s valuation, why elevated yields demand cautious interpretation, what the three operating divisions contribute to the long-term investment case, and what risks still sit between today’s price and any genuine recovery.
The arithmetic is straightforward. At A$99.76, with a total FY2024 dividend of approximately A$3.97 per share (interim A$1.799, final A$2.175), CSL’s dividend yield sits at approximately 4%. The five-year historical average is closer to 1.5%. That gap is wide enough to register on any yield-based screen.
The practical limitation of dividend yield as a valuation signal is that yield expansion can be driven entirely by price collapse rather than any improvement in distribution quality, meaning a rising yield and deteriorating investment case can coexist in the same stock at the same time.
CSL’s dividend yield has risen to approximately 4%, more than double its five-year historical average of around 1.5%.
| Metric | Current (May 2026) | Historical Average (5-Year) |
|---|---|---|
| Dividend yield | ~4% | ~1.5% |
| Share price | A$99.76 | Materially higher |
| FY2024 total dividend per share | ~A$3.97 | Modest growth trend |
The critical detail sits beneath the headline number. Nearly all of this yield expansion has been driven by the share-price decline, not a step-change in distributions. CSL has grown its dividend modestly, but a 42% fall in the share price is doing most of the mathematical work.
A dividend yield above historical norms can suggest undervaluation. It is a useful starting-point filter, not a conclusion. The signal is only bullish if the dividend is sustainable and the earnings base supporting it is expected to hold.
For CSL, that caveat is live rather than theoretical. Near-term earnings pressure, documented in the H1 FY2026 results released in February 2026, means the sustainability question requires more than arithmetic. It requires a view on where earnings are headed.
Dividend yield measures the annual dividend payment as a percentage of the current share price. When a share price falls and the dividend stays roughly the same, the yield rises. When a share price rises and the dividend holds steady, the yield compresses. The relationship is inverse, and it is mechanical.
Comparing a stock’s current yield to its historical average is one of the simplest relative-value filters available. If the yield is meaningfully above its long-run average, the share price may be low relative to what the company distributes. The limitation is that this filter assumes the historical average is a fair reference point, and that the earnings base supporting the dividend will persist.
Yield expansion can occur in three distinct scenarios, each carrying a different signal:
In CSL’s case, the yield rise is predominantly price-driven. The FY2024 total dividend of approximately A$3.97 per share exceeded the three-year average, confirming modest distribution growth alongside the much larger price-driven move. This makes the signal more interesting than a pure earnings collapse, but patience is required.
The critical next step is to cross-reference the yield signal with the underlying business’s earnings trajectory before treating it as actionable.
CSL reports across three divisions, each with a distinct growth profile. The H1 FY2026 results (six months to 31 December 2025) showed group revenue of US$8.3 billion, down 4% on a constant-currency basis. Underlying NPATA came in at US$1.9 billion, down 7%. Reported NPAT fell 81% to US$401 million, a figure that warrants careful unpacking.
| Division | H1 FY2026 Revenue (USD) | Change (Constant Currency) | Key Dynamic |
|---|---|---|---|
| CSL Behring | US$5.5 billion | Down 7% | Strategic transition costs; margin pressure |
| CSL Seqirus | US$1.6 billion | Down 2% | Non-recurrence of avian influenza revenue |
| CSL Vifor | US$1.2 billion | Up 12% | Nephrology momentum; generic competition ongoing |
The divergence across divisions is the story. CSL Vifor grew revenue by 12%, supported by nephrology product momentum. CSL Behring, the largest contributor at US$5.5 billion, declined 7% on a constant-currency basis as strategic transition costs weighed on margins. CSL Seqirus dipped 2%, partly because the prior period included non-recurring avian influenza-related revenue. Recent company reporting has emphasised portfolio simplification, cost control, and margin recovery as the medium-term response.
The plasma franchise recovery thesis rests partly on CSL Behring’s approximately 42% share of the global immunoglobulin market, a structural position with no widely available biosimilar substitutes, and on early Seqirus pre-order data showing approximately 15% year-on-year growth for the 2026-2027 flu season, the first concrete signal that the vaccines division demand trough may be passing.
The 81% decline in reported NPAT is the figure most likely to alarm a casual observer. It largely reflects one-off impairments and restructuring charges rather than an operational collapse.
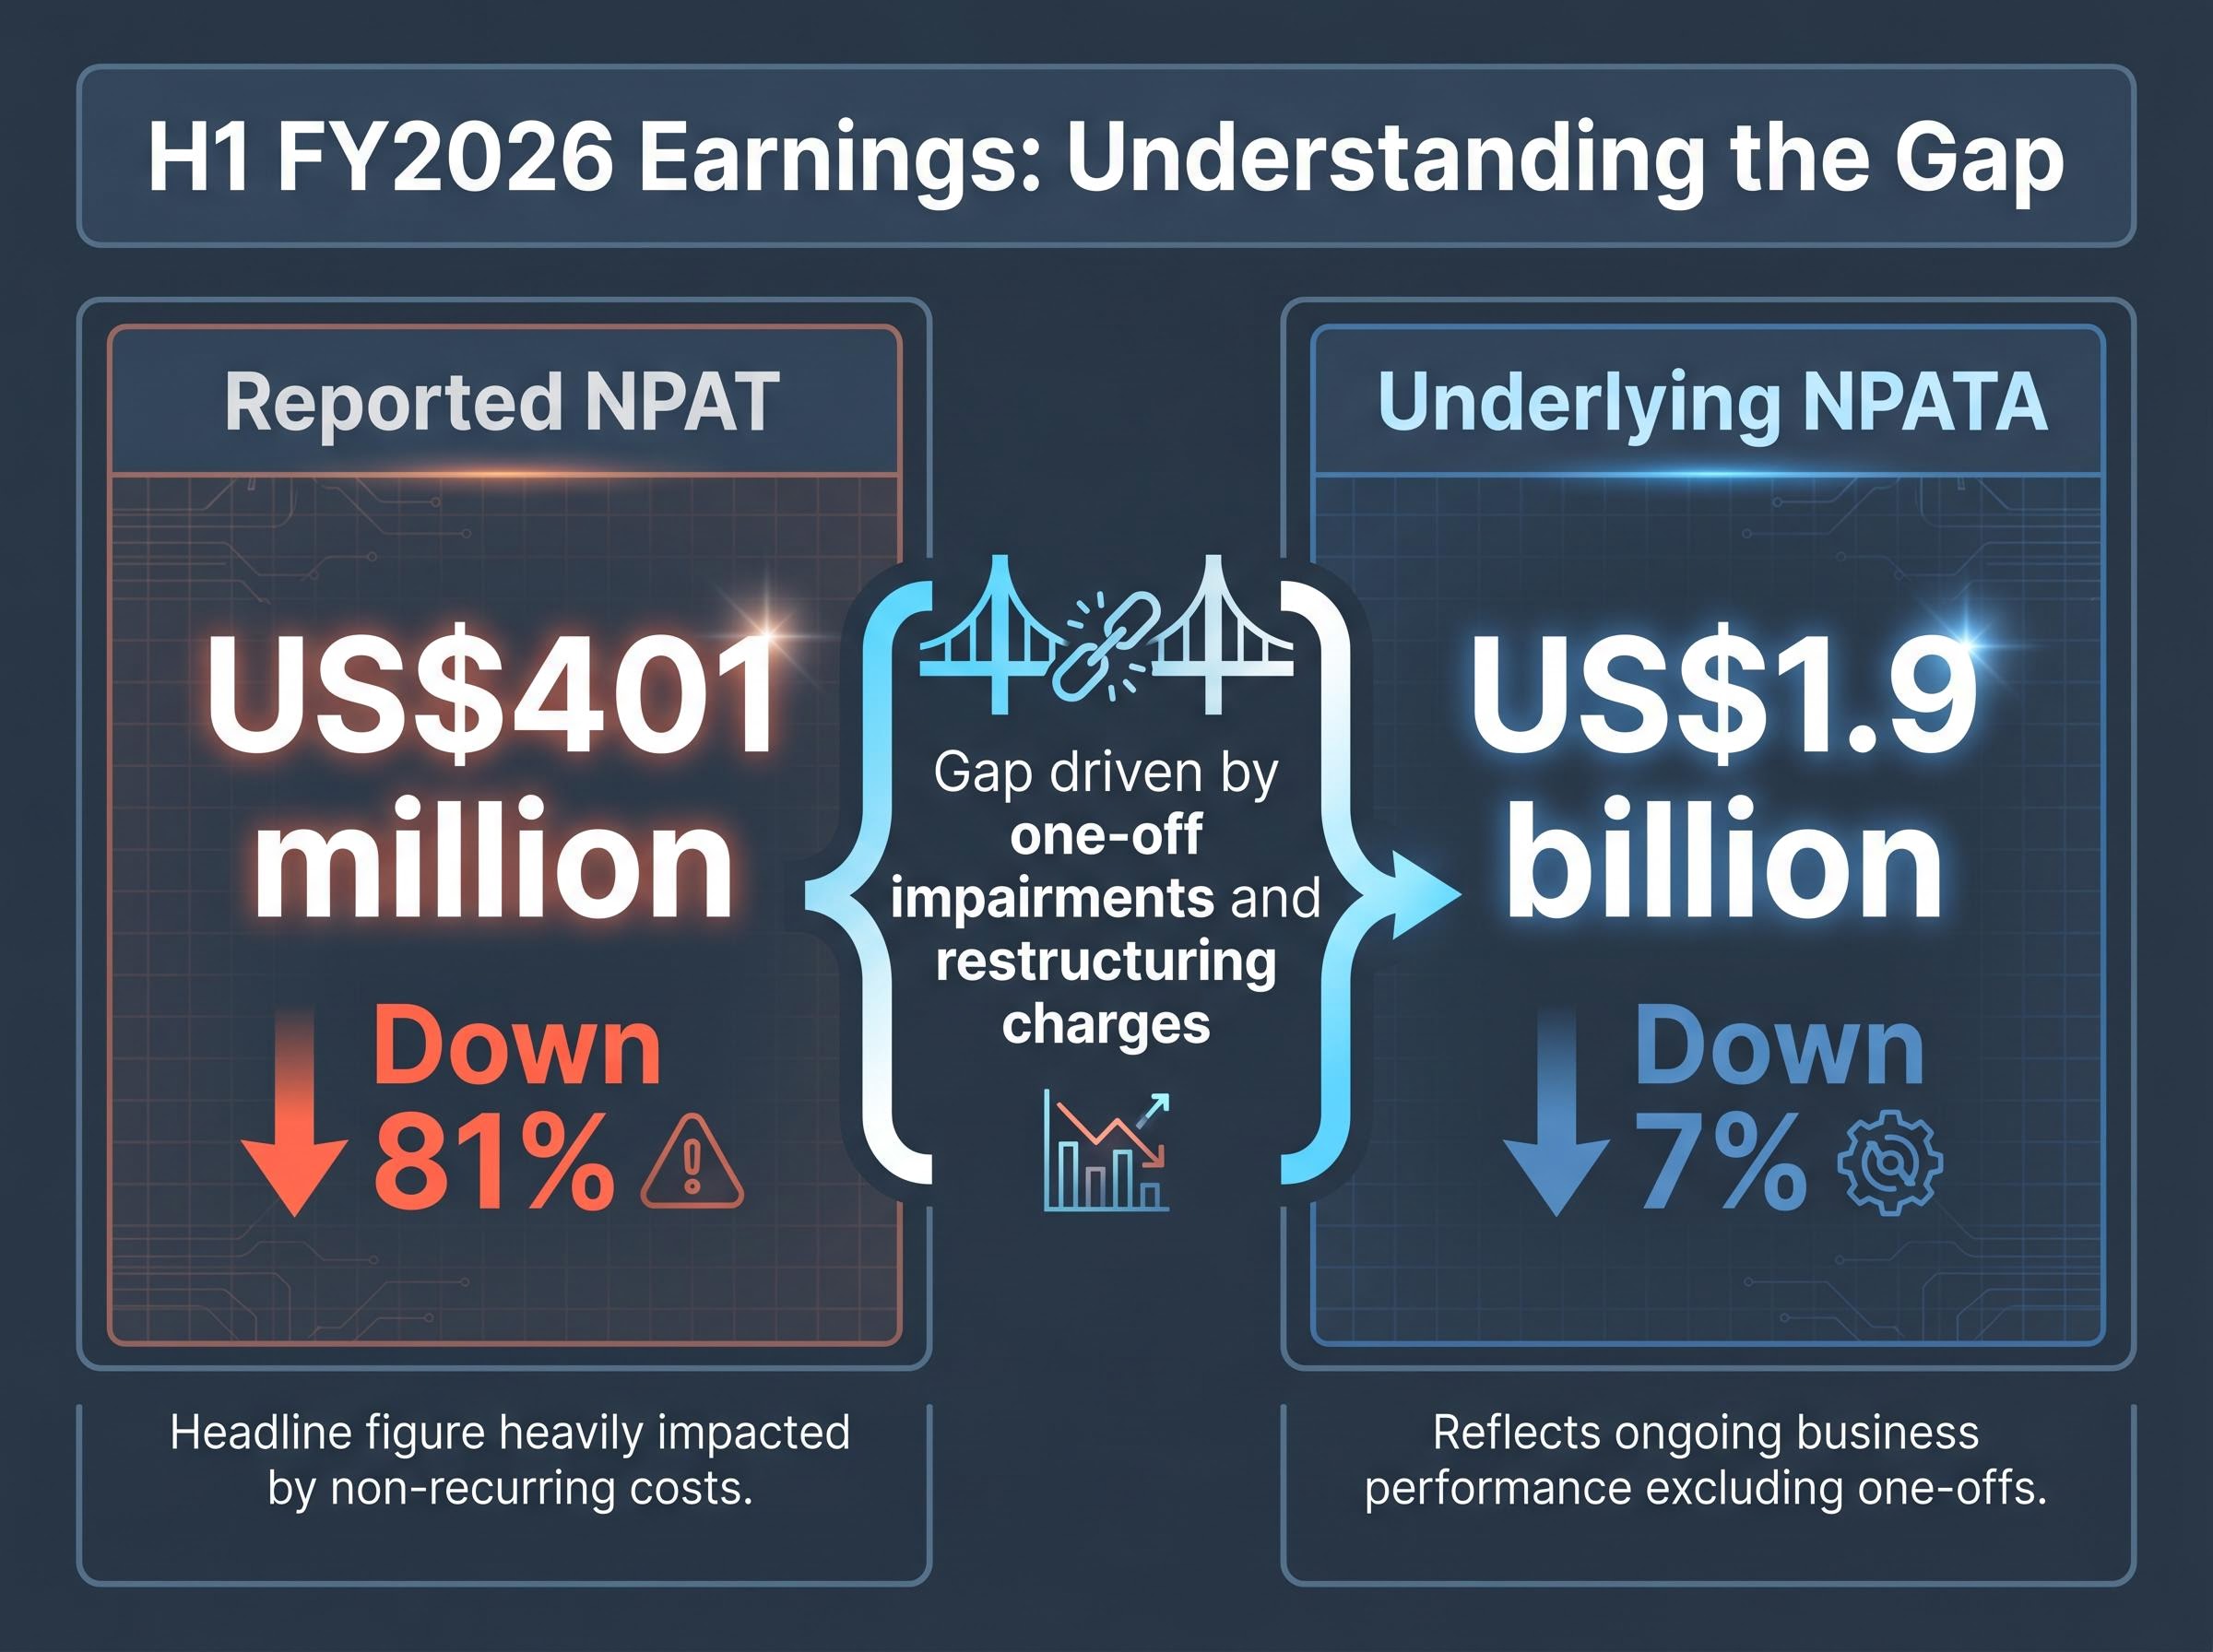
Underlying NPATA of US$1.9 billion, down 7%, is the more informative measure of operational performance. The gap between US$401 million in reported NPAT and US$1.9 billion in underlying NPATA is almost entirely attributable to charges that are not expected to recur. Australian fund managers and financial media have cited this distinction when arguing the selloff may have overshot the underlying deterioration.
The ASX continuous disclosure obligations under Listing Rules 3.1, 3.1A, and 3.1B require listed companies to immediately disclose material information to the market, which means the earnings impairments and restructuring charges that drove the gap between CSL’s reported NPAT and underlying NPATA were subject to prompt release once they became known.
Four categories of risk sit between the current yield signal and a clear-cut value conclusion. Each carries a different duration and probability profile:
The yield improvement is price-driven, not distribution-driven, and earnings revisions remain a live risk. These two facts constrain the conviction available from the yield signal alone.
Earnings revisions have not yet stabilised. Until the forward earnings picture firms, the yield signal remains suggestive rather than conclusive.
Investors wanting to work through the structural versus cyclical distinction in more depth will find our deep-dive into the CSL value trap debate examines the full broker rating landscape, including four of five major brokers holding Buy-equivalent ratings with price targets of A$270-A$310, alongside the specific conditions under which a repricing of this magnitude becomes permanent rather than recoverable.
Dividend yield comparison is a first-pass filter. It highlights stocks where the market price has dislocated from historical norms, but it assumes mean reversion and a stable earnings base, neither of which is guaranteed.
More comprehensive methods are available for investors seeking conviction-level analysis. Discounted Cash Flow (DCF) models project future cash flows and discount them to present value. Dividend Discount Models (DDM) estimate fair value based on expected future distributions. Both require assumptions about margin recovery timing, revenue growth, and discount rates.
A three-step valuation sequence offers a structured approach:
Australian investors have access to these frameworks through common platforms and resources available to ASX-focused retail participants.
For investors wanting to build the DCF or DDM models that would take the CSL analysis to a conviction-level view, our dedicated guide to ASX share valuation methods walks through a structured five-step sequence covering price-to-sales screening, EV/EBITDA benchmarking, discounted cash flow construction, dividend discount modelling, and cross-check methodology, with worked examples drawn from ASX-listed companies.
Applied to CSL: the yield screen passes (step 1); underlying NPATA is under pressure but not collapsing (step 2 is cautious); and a DCF requires assumptions about margin recovery timing that are genuinely uncertain (step 3 is contested).
The weight of Australian commentary, from fund-manager notes on Livewire Markets to analysis in the Australian Financial Review, lands on “more interesting, but patience required” as the honest summary of where the evidence sits.
CSL’s valuation setup has materially improved relative to prior years. The dividend yield at approximately 4% against a five-year average of roughly 1.5% is the clearest quantitative signal available, and price-to-earnings compression has reinforced it. The long-term franchise quality of the business is not in serious dispute across Australian financial media.
The question for investors is not whether CSL offers better value than it did in 2024. It does. The question is whether A$99.76 adequately compensates for the earnings uncertainty and execution risk that remain across all three divisions.
CSL’s valuation setup has materially improved, but the path to recovery depends on execution outcomes that are not yet confirmed. The yield signal is real; the earnings trajectory is not yet settled.
Australian fund managers and financial media broadly characterise the setup as more compelling than in prior years without consensus on immediate timing. The yield analysis serves as a starting point for further research, not a buy trigger in isolation. Investors assessing their own time horizon and risk tolerance will determine whether this dislocation represents opportunity or a value trap that requires further patience.
This article is for informational purposes only and should not be considered financial advice. Investors should conduct their own research and consult with financial professionals before making investment decisions. Past performance does not guarantee future results. Financial projections are subject to market conditions and various risk factors.
Dividend yield measures the annual dividend payment as a percentage of the current share price; when a share price falls and the dividend stays roughly the same, the yield rises. For CSL, a 42% share price decline has pushed the yield to approximately 4%, well above its five-year historical average of around 1.5%, which some investors use as a relative-value signal.
The decline reflects a combination of near-term earnings pressure, strategic transition costs in CSL Behring, non-recurring avian influenza revenue in CSL Seqirus, and generic competition in CSL Vifor's iron-deficiency products, alongside broader valuation compression. H1 FY2026 results showed group underlying NPATA down 7% and reported NPAT down 81%, largely due to one-off impairments and restructuring charges.
A structured three-step approach is recommended: first use the elevated yield as an initial filter, then assess whether the underlying earnings base supporting the dividend is stable or deteriorating, and finally build a discounted cash flow or dividend discount model to form a conviction-level view. The yield signal alone is not sufficient because earnings revisions for CSL remain unsettled as of May 2026.
Underlying NPATA (net profit after tax and amortisation) strips out one-off items such as impairments and restructuring charges to show the operational earnings trend; CSL's H1 FY2026 underlying NPATA was US$1.9 billion, down 7%, compared to reported NPAT of US$401 million, down 81%. The large gap between the two figures is almost entirely attributable to non-recurring charges rather than an operational collapse.
CSL Vifor is the only division showing revenue growth in H1 FY2026, with a 12% increase driven by nephrology product momentum, while CSL Behring declined 7% and CSL Seqirus declined 2% on a constant-currency basis.