
CSL’s Dividend Yield Hits 4%: Value Signal or Value Trap?
22 mins ago

Commonwealth Bank of Australia (CBA) generates a return on equity of 13.1%, sitting nearly four percentage points above the ASX major bank average of 9.35%. That gap is not a rounding error or a temporary anomaly. It is the quantitative signature of a structurally different kind of bank.
Australian investors face a specific dilemma regarding the sector leader. CBA trades at a persistent premium to peers, while analyst consensus remains broadly sceptical due to the current share price. Understanding any CBA valuation requires moving past market sentiment to examine the operating metrics that actually determine long-run bank profitability.
This analysis benchmarks CBA against ANZ, NAB, and Westpac using the most recently reported figures from the 1H FY26 reporting season. Evaluating the structural reasons CBA consistently leads the sector across net interest margin, return on equity, and capital reserves reveals exactly what investors are paying for.
The spread between CBA and its peers becomes immediately apparent when viewing the core operational metrics side by side. Investors evaluating whether CBA’s market premium is deserved need a clean baseline before interpreting the broader sector dynamics.
The data below presents the three most critical banking metrics across all four major banks. These figures draw from the most recent 1H FY26 results, reflecting the six months to 31 March 2026, alongside recent full-year data for CBA to ensure an accurate comparative picture.
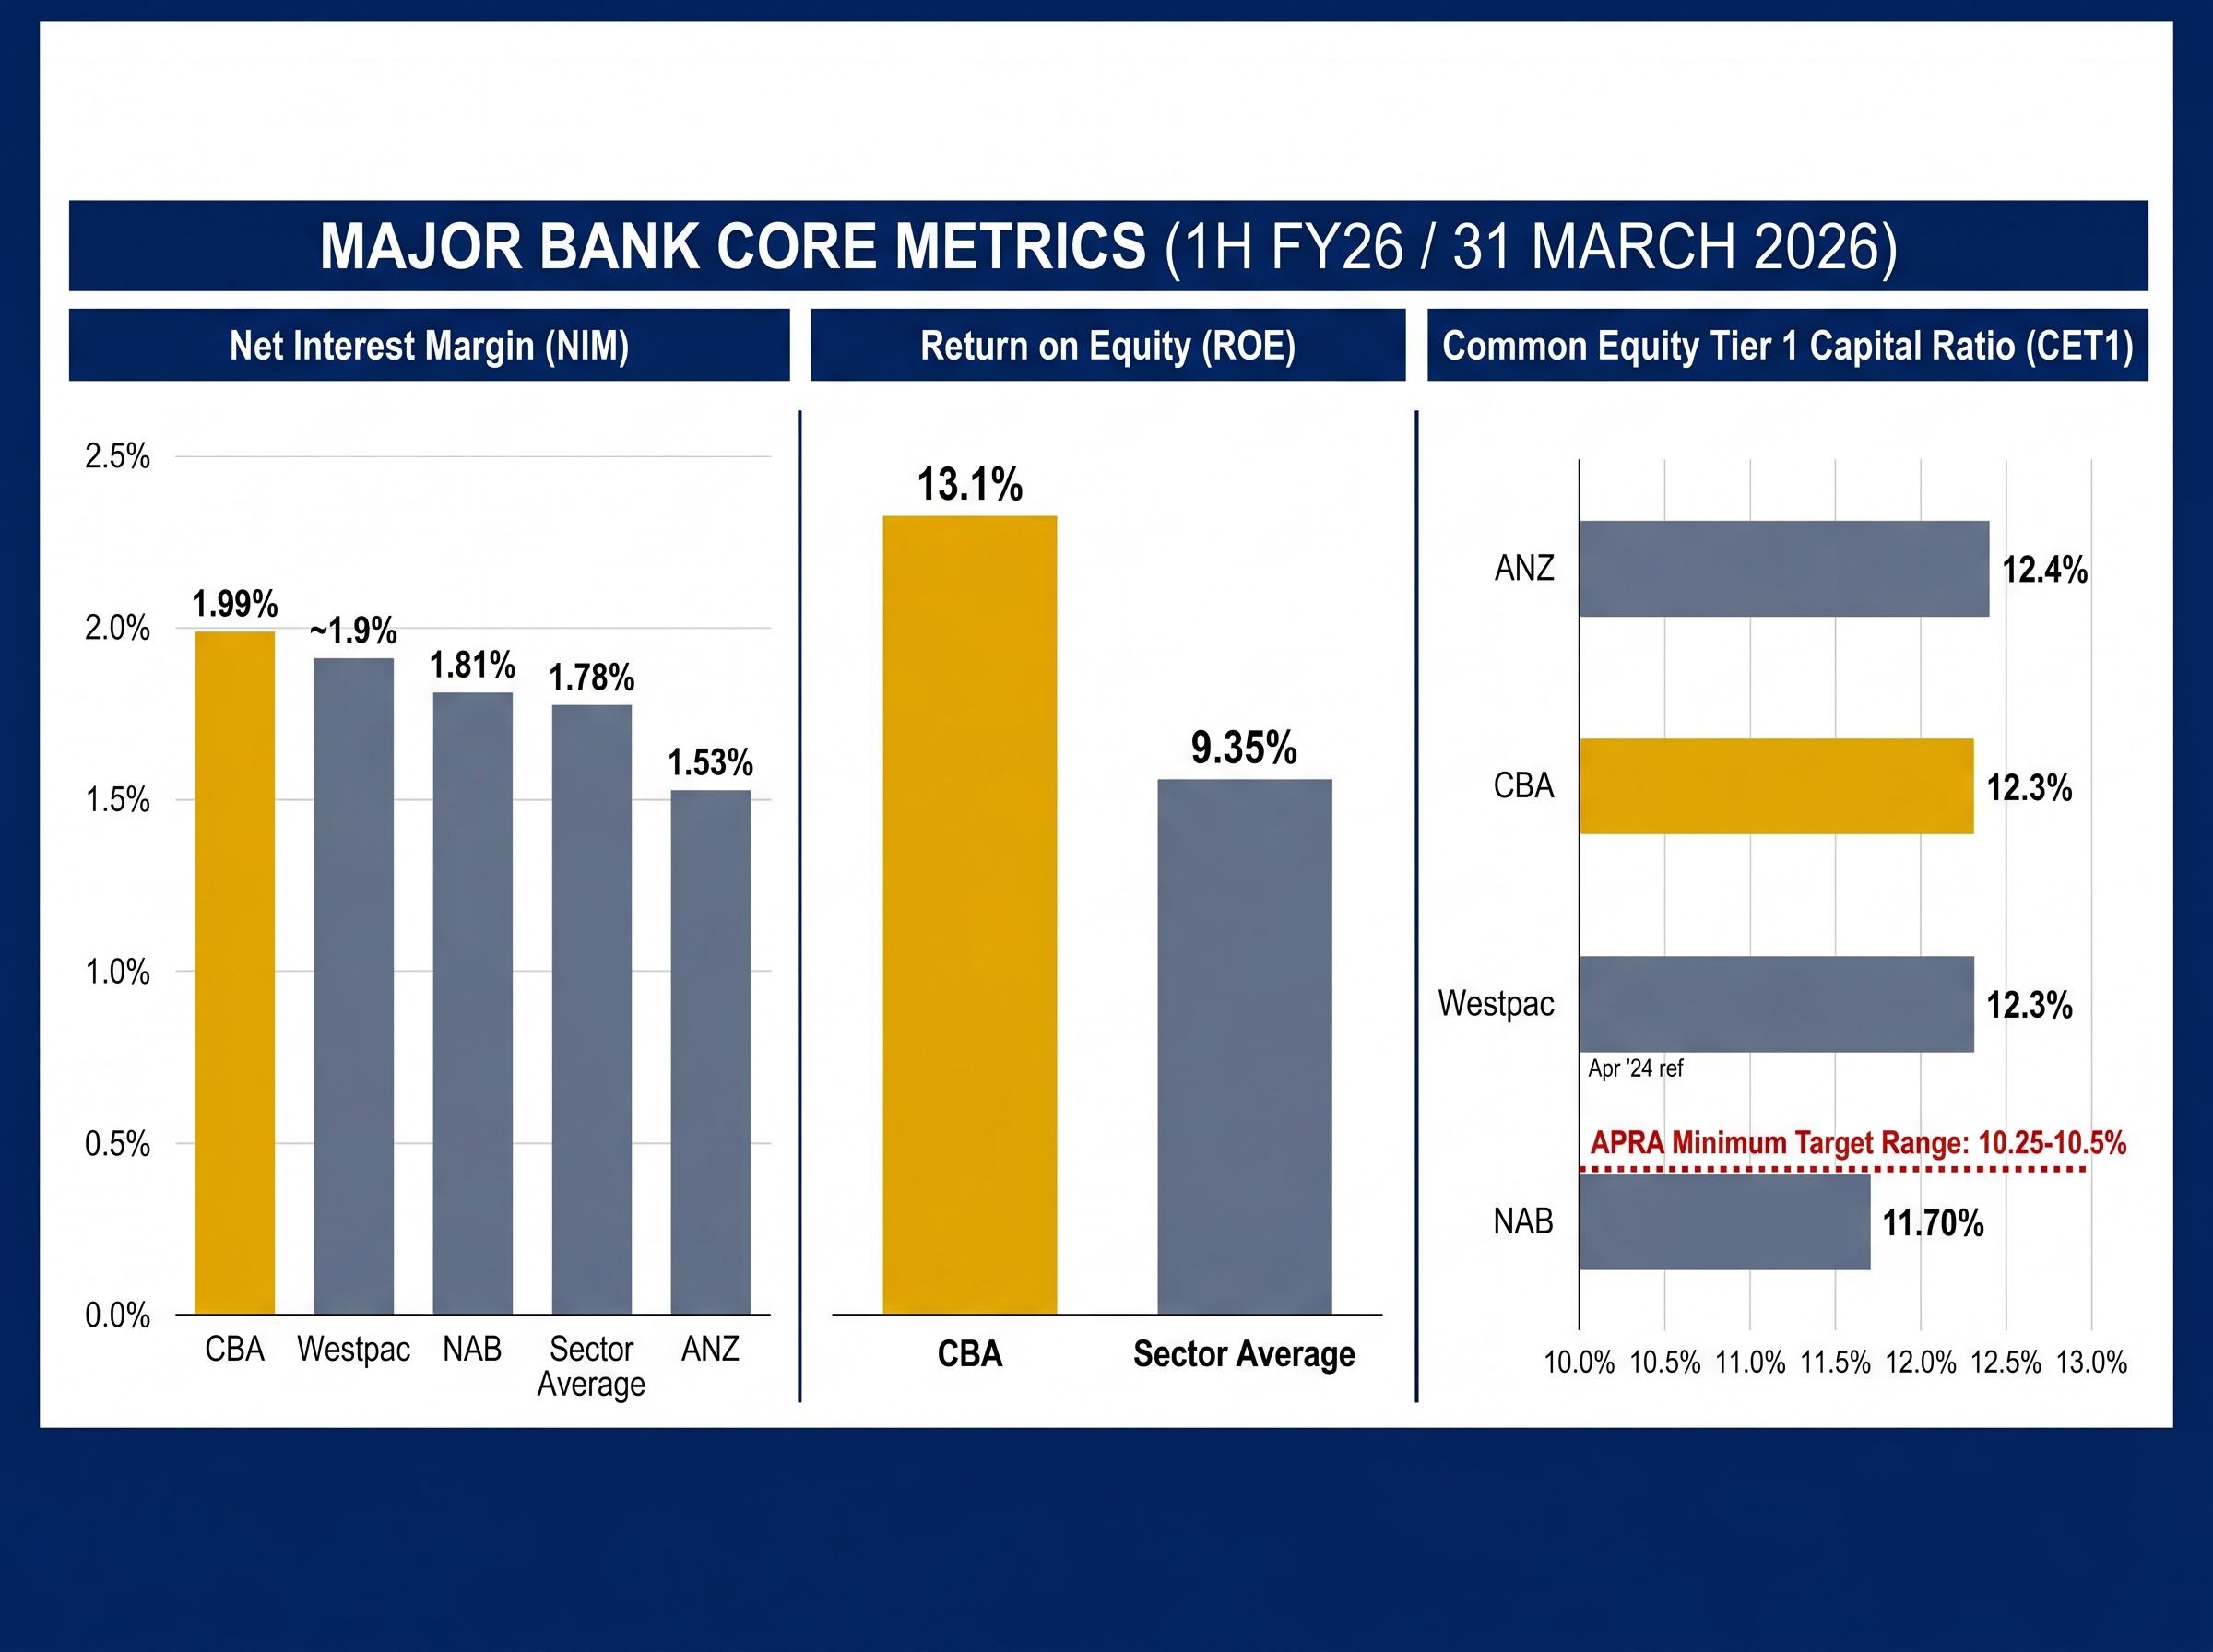
| Bank | NIM | ROE | CET1 Ratio | Period |
|---|---|---|---|---|
| CBA | 1.99% | 13.1% | 12.3% | Full Year / 1H FY26 |
| NAB | 1.81% | Not specified | 11.70% | 1H FY26 |
| ANZ | 1.53% | Not specified | 12.4% | 1H FY26 |
| Westpac | ~1.9% | Not specified | 12.3% (Apr ’24 ref) | 1H FY26 |
| Sector Average | 1.78% | 9.35% | N/A | 1H FY26 |
CBA operates with a return on equity of 13.1%, standing far above the ASX major bank sector average of 9.35%.
These metrics establish a factual picture of sector dominance. The regulatory floor remains relevant, with the Australian Prudential Regulation Authority (APRA) minimum Common Equity Tier 1 (CET1) target range confirmed unchanged at approximately 10.25-10.5% as of May 2026.
Financial terminology can obscure the relatively simple mechanics of how a bank generates profit and manages risk. Before analysing why CBA leads the sector, it is necessary to establish exactly what these three specific metrics capture.
Analysts prioritise these figures because they isolate the core functions of banking from the broader noise of statutory profit announcements. Lending activities represent approximately 85% of CBA’s total income, making interest capture a fundamental driver of group performance. All four major banks operate well above APRA minimums by deliberate strategic choice, ensuring their capital buffers exceed the “unquestionably strong” framework requirements.
The following measures provide the most accurate assessment of a bank’s operational efficiency, profitability, and defensive strength.
Net Interest Margin (NIM): The difference between what a bank earns on loans and what it pays for deposits, expressed as a percentage of interest-earning assets. Return on Equity (ROE): The annual profit generated per dollar of shareholders’ equity, which matters more than raw profit because it allows direct comparison between banks of different sizes. * Common Equity Tier 1 (CET1): The proportion of a bank’s risk-weighted assets covered by the highest-quality capital, functioning as the primary buffer against credit losses.
Investors who understand why these specific numbers matter are better positioned to interpret deviations. By grasping these mechanics, shareholders can form independent judgements about whether an institution’s profit engine is accelerating or stalling.
Analysts applying a structured bank due diligence framework typically assess ROE against the cost of equity, price-to-book against forward ROE, NIM sensitivity, arrears trends, CET1 ratios, and deposit share together, because each metric can flatter or mislead when examined in isolation.
CBA earns more per dollar lent than any other major Australian bank. While the sector average NIM sits at 1.78%, CBA operates at 1.99%, creating a substantial revenue advantage across a multi-billion dollar lending book.
This gap is a durable structural feature rather than a recent pricing decision. The advantage is rooted in a dominant low-cost retail deposit franchise, combined with a high share of at-call transaction accounts that permanently reduce funding costs. While ANZ and Westpac recently recaptured some margin as they repriced deposits, printing 1.53% and approximately 1.9% respectively in 1H FY26, CBA’s structural lead persists.
Broker analysts consistently frame CBA’s NIM advantage as “structural but moderating at the margin” due to ongoing mortgage competition.
Broker analysts consistently frame CBA’s NIM advantage as structural but moderating, a view reinforced by the 1H FY26 reporting season in which sector-wide NIM compression, driven by deposit competition and mortgage refinancing pressure, prompted Morgan Stanley to reverse a 4% sector earnings upgrade and triggered share price declines of 7-14% across the Big Four.
The bank leverages its national mortgage market share of greater than 20% to enforce strict pricing discipline. This scale allows the institution to walk away from low-margin lending segments while sustaining overall volume.
Deposit Franchise: A dominant base of low-cost retail transaction accounts provides cheap, stable funding that competitors struggle to replicate. Pricing Discipline: Unmatched market scale enables the bank to reject unprofitable mortgage wars without sacrificing overall book growth.
The headline ROE gap of approximately 3.75 percentage points is a summary outcome. CBA achieves 13.1% against a sector average of 9.35% through a compounding set of operational and strategic advantages that act as protective moats.
This superior return profile stems directly from the bank’s relationship with over 15 million Australian customers. Holding a credit card market share exceeding 25% and a mortgage share above 20%, the bank achieves unparalleled scale economics. Conservative underwriting limits loan-loss charges through economic cycles, producing a more durable return profile compared to peers holding greater institutional credit exposure.
Sustained technology investment acts as a direct multiplier for operational efficiency. The CommBank app reduces cost-per-customer while superior data analytics improve credit risk pricing, directly lowering the cost-to-income ratio.
Capital adequacy extends beyond regulatory compliance to directly inform dividend durability. A bank’s CET1 ratio represents its raw material for capital returns, share buybacks, and crisis absorption.
The major banks sit comfortably above APRA’s approximately 10.25-10.5% minimum target range. In 1H FY26, ANZ reported a CET1 ratio of 12.4%, NAB reported 11.70%, and CBA maintains a strong position at 12.3%. Operating this far above the regulatory floor signals highly conservative management and preserves flexibility for future capital management initiatives.
APRA’s unquestionably strong capital framework increased the CET1 requirement for major banks by 2.25 percentage points, establishing the 10.25% floor that all four majors now operate well above as a matter of deliberate strategic choice rather than mere compliance.
CBA’s CET1 ratio of 12.3% provides a substantial defensive buffer above the APRA minimum floor of approximately 10.25-10.5%.
The bank has continued paying ordinary dividends consistent with its profitability through 2025 and into 2026. While no major new buyback announcement has been confirmed in open sources since January 2025, the surplus capital provides distinct options for the board.
Dividend Sustainability: High capital buffers ensure regular dividend payouts remain protected during minor economic contractions. Potential Buybacks: Surplus equity grants management the optionality to reduce share count and artificially boost future per-share earnings. * Crisis Absorption: Unquestionably strong capital reserves prevent the need for dilutive emergency capital raisings during severe credit shocks.
The structural advantages supporting CBA’s market dominance are real and well-evidenced. However, the current share price forces investors to decide whether those operational strengths are already fully priced in.
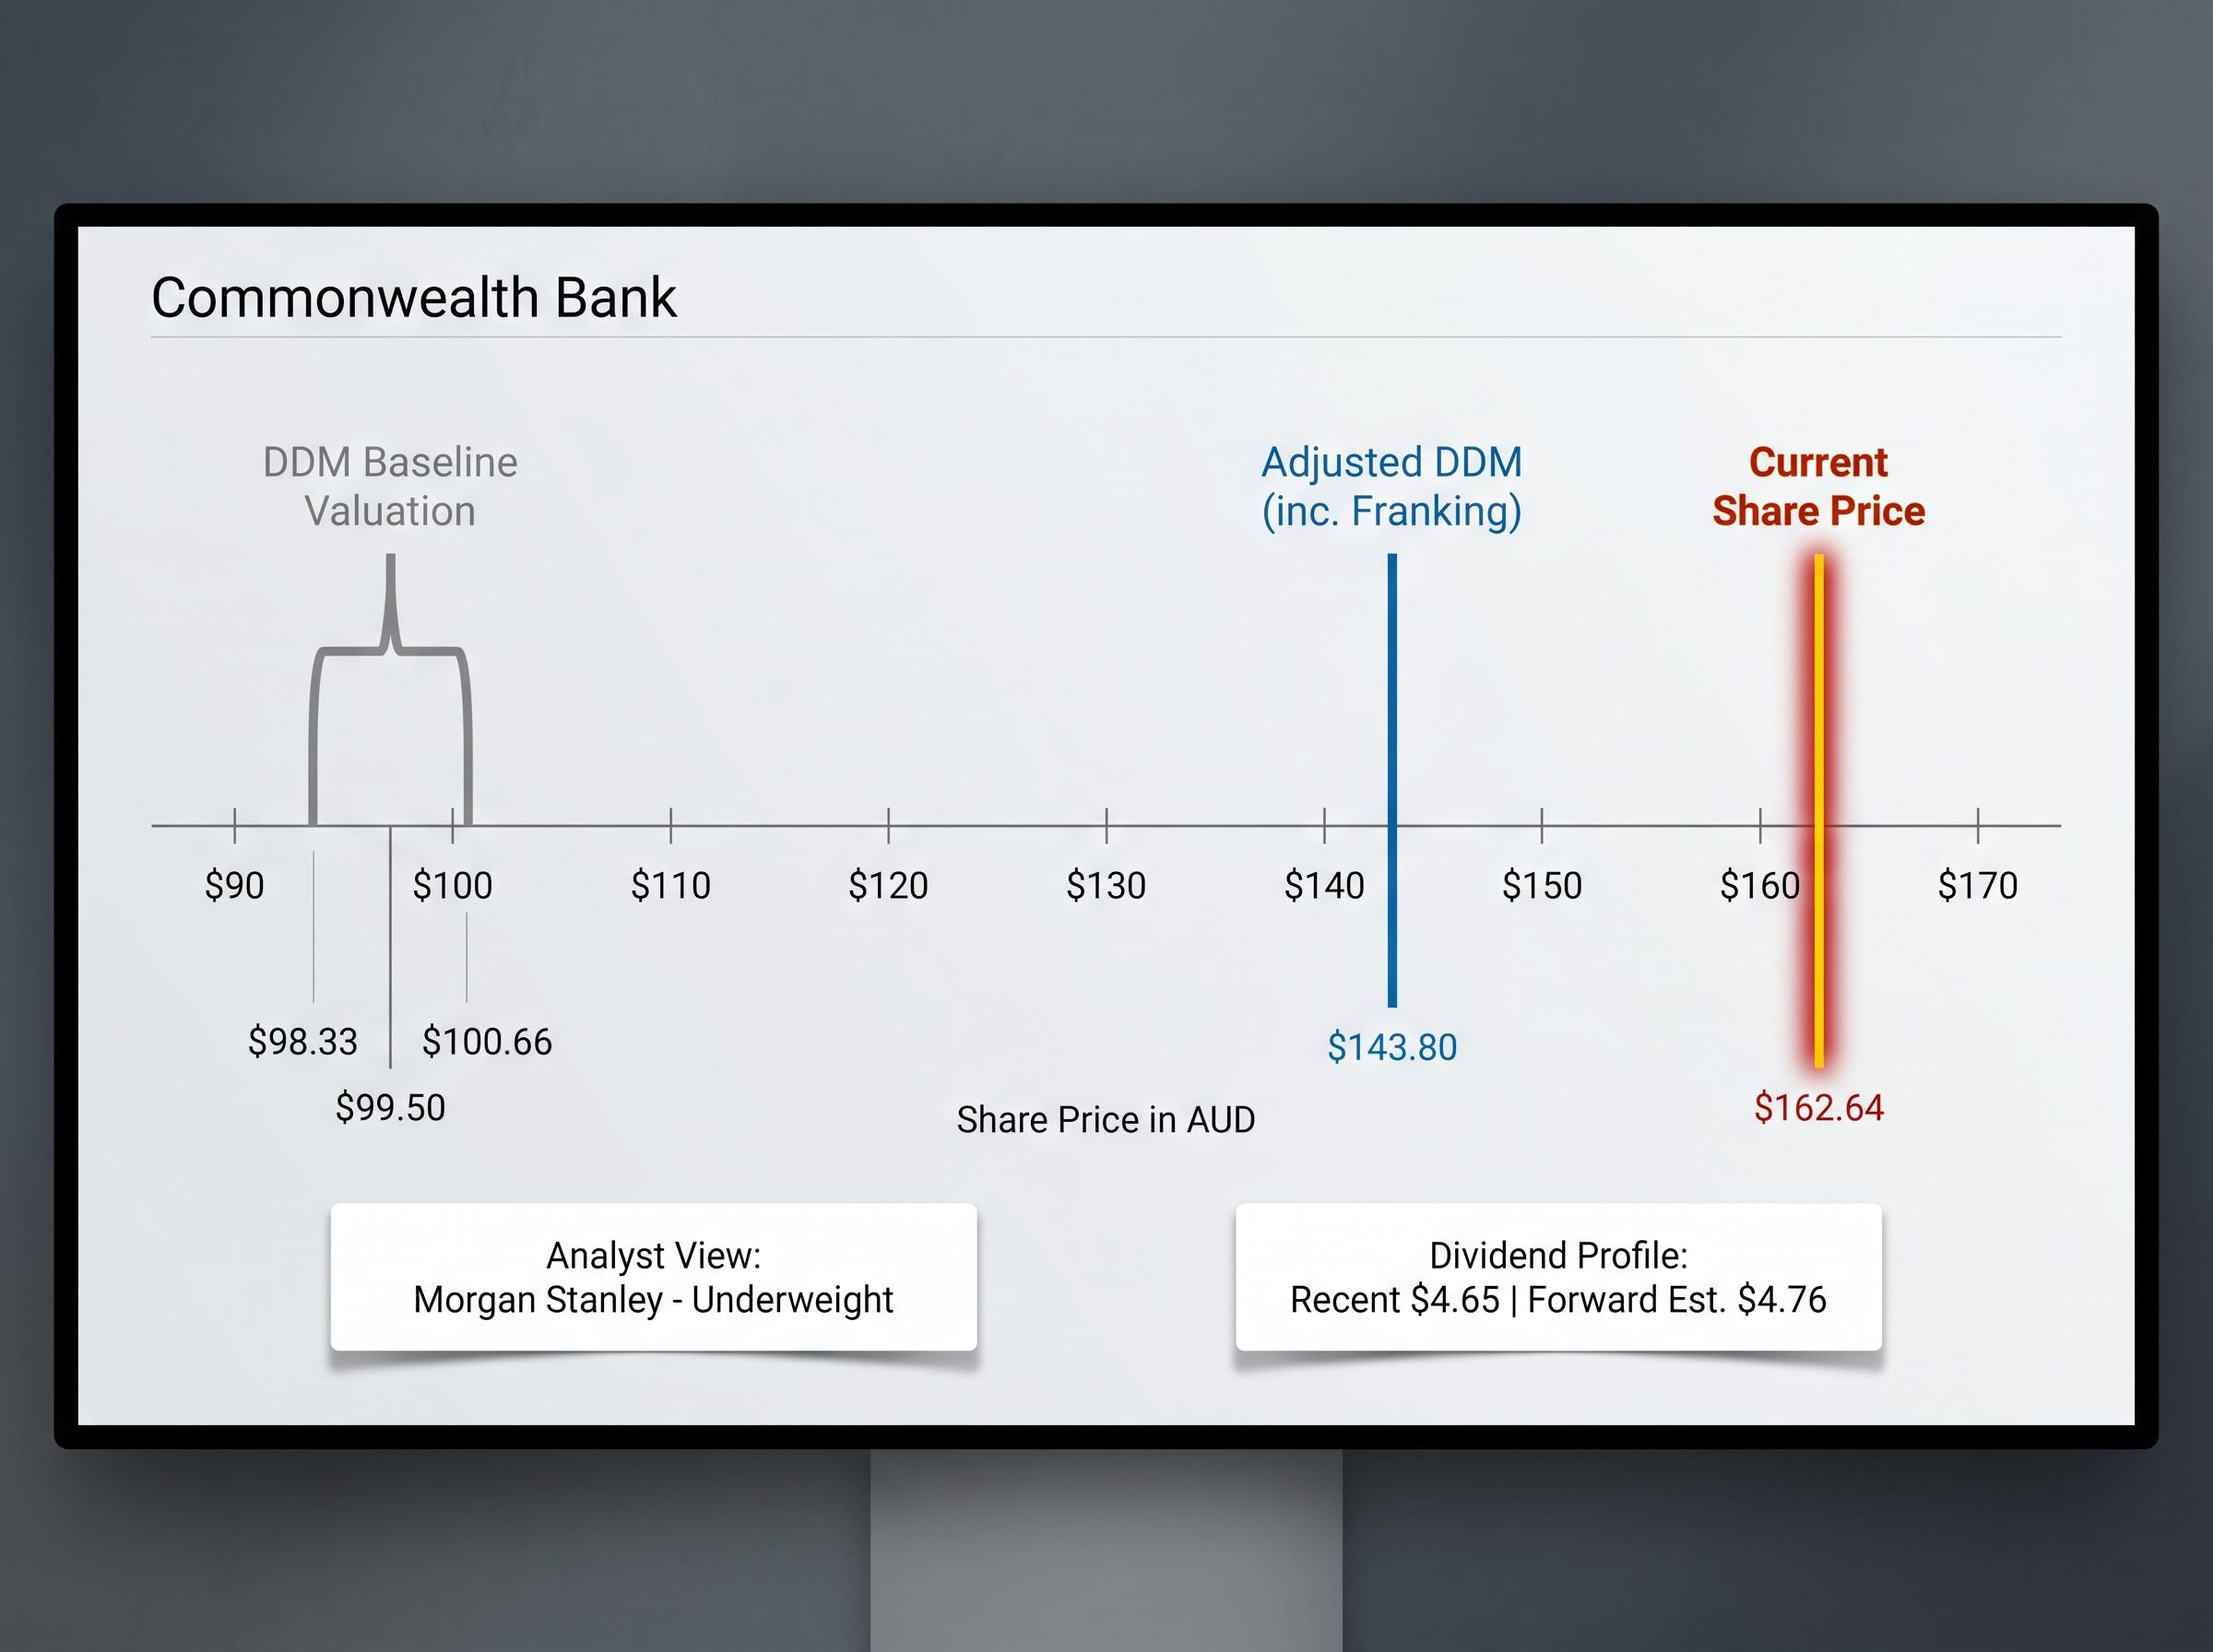
Brokers broadly accept the bank’s structural superiority, yet they routinely assign Hold, Neutral, or Underweight ratings. At the time of publication, CBA trades at $162.64, sitting well above most analyst price targets. Dividend Discount Model (DDM) outputs produce average valuations ranging from approximately $98.33 to $100.66 per share, or $143.80 when adjusting for gross dividends and franking credits.
The macro assumptions behind bank valuations can shift the modelled fair value of a major bank by more than 100% across plausible input ranges, which is why two credible analysts covering the same institution can simultaneously hold a Sell rating at $37 and a Buy rating at $50 without either position representing an arithmetic error.
Broker consensus acknowledges CBA’s structural advantages while assigning cautious ratings due to the price already reflecting those advantages.
Morgan Stanley maintains an Underweight rating with a target below the prevailing market price. The institution delivered a recent full-year dividend of $4.65 per share, with forward estimates projecting $4.76. The metrics establish exactly why the business commands a premium, but the size of that premium remains genuinely contested.
What the metrics confirm: Unmatched sector profitability, superior funding costs, and exceptional defensive capital buffers. What the metrics cannot resolve: Whether paying a historically high earnings multiple for a low-growth mature business leaves sufficient margin of safety for new capital.
CBA’s NIM, ROE, and CET1 collectively describe an institution that earns more, returns more, and absorbs risk better than its direct competitors. This trifecta is structural, born from decades of retail dominance and technological investment that peers cannot easily replicate.
However, metrics only describe the quality of a business at a specific point in time. They do not dictate whether the current share price represents an appropriate entry point for deploying new capital. Investors who understand exactly why this bank leads on every major metric are better equipped to judge whether its market premium remains justified.
CBA’s forward earnings multiple of 26-27x sits roughly double the bank’s historical average of 18x, and with all 14 covering analysts holding Sell ratings as of late April 2026 and a consensus price target of $130.34, the market premium the structural metrics justify appears to have compounded into a valuation level that prices in sustained outperformance the earnings trajectory does not currently support.
This article is for informational purposes only and should not be considered financial advice. Investors should conduct their own research and consult with financial professionals before making investment decisions.
Return on equity measures the annual profit a bank generates per dollar of shareholders' equity, allowing direct size-adjusted comparisons between banks. CBA's ROE of 13.1% sits nearly four percentage points above the ASX major bank sector average of 9.35%, indicating a structurally more profitable business model.
CBA reported a net interest margin of 1.99% in the most recent reporting period, well above the sector average of 1.78%, with ANZ at 1.53% and NAB at 1.81% as comparisons. This advantage is driven by CBA's dominant low-cost retail deposit franchise and strict mortgage pricing discipline.
CBA maintains a CET1 ratio of 12.3%, comfortably above APRA's minimum target range of approximately 10.25-10.5% for major banks. This surplus capital supports dividend sustainability and provides flexibility for potential share buybacks or crisis absorption without emergency capital raisings.
Brokers broadly acknowledge CBA's structural advantages but assign Hold, Neutral, or Underweight ratings because the share price at $162.64 significantly exceeds most analyst price targets, with a consensus target of $130.34 and all 14 covering analysts holding Sell ratings as of late April 2026. CBA's forward earnings multiple of 26-27x is roughly double its historical average of 18x.
CBA's outperformance is driven by a combination of a dominant low-cost retail deposit franchise, mortgage market share above 20%, credit card market share exceeding 25%, sustained technology investment that lowers the cost-to-income ratio, and conservative underwriting that limits loan-loss charges through credit cycles. These advantages compound to produce superior NIM, ROE, and capital strength relative to peers.