
What a $2B Government Equity Stake Means for Quantum Stocks
2 mins ago

The ASX 200 is sitting on a level that technical analysts have characterised as a “stay of execution” rather than a confirmed floor, with Australian equity risk allocation recommended at just one-third of maximum allowable as of 9 June 2026. Five macro events across Wednesday, Thursday, and Friday, spanning US inflation data, the European Central Bank (ECB) rate decision, producer prices, a 30-year Treasury auction, and consumer sentiment, each carry the potential to shift global risk appetite. They arrive as both the Nasdaq Composite and the ASX 200 sit on fragile technical support with almost no margin for error.
What follows is a walk through each event: what the data currently signals, what the specific scenario thresholds are, and how ASX investors can use the outcomes to make informed allocation decisions across the week.
Before the data arrives, the technical picture is already stretched. The recommended Australian equity risk allocation stands at one-third of maximum allowable, a position that reflects the chart structure rather than a discretionary preference. Both the Nasdaq and the ASX 200 are at levels where one bad session could force mechanical de-risking.
Carl Capolingua, Market Index, characterised the ASX 200’s intraday recovery on 9 June as a “stay of execution” rather than a confirmed trend reversal, noting the broader chart lacked evidence of sufficient excess demand to drive a sustained move higher.
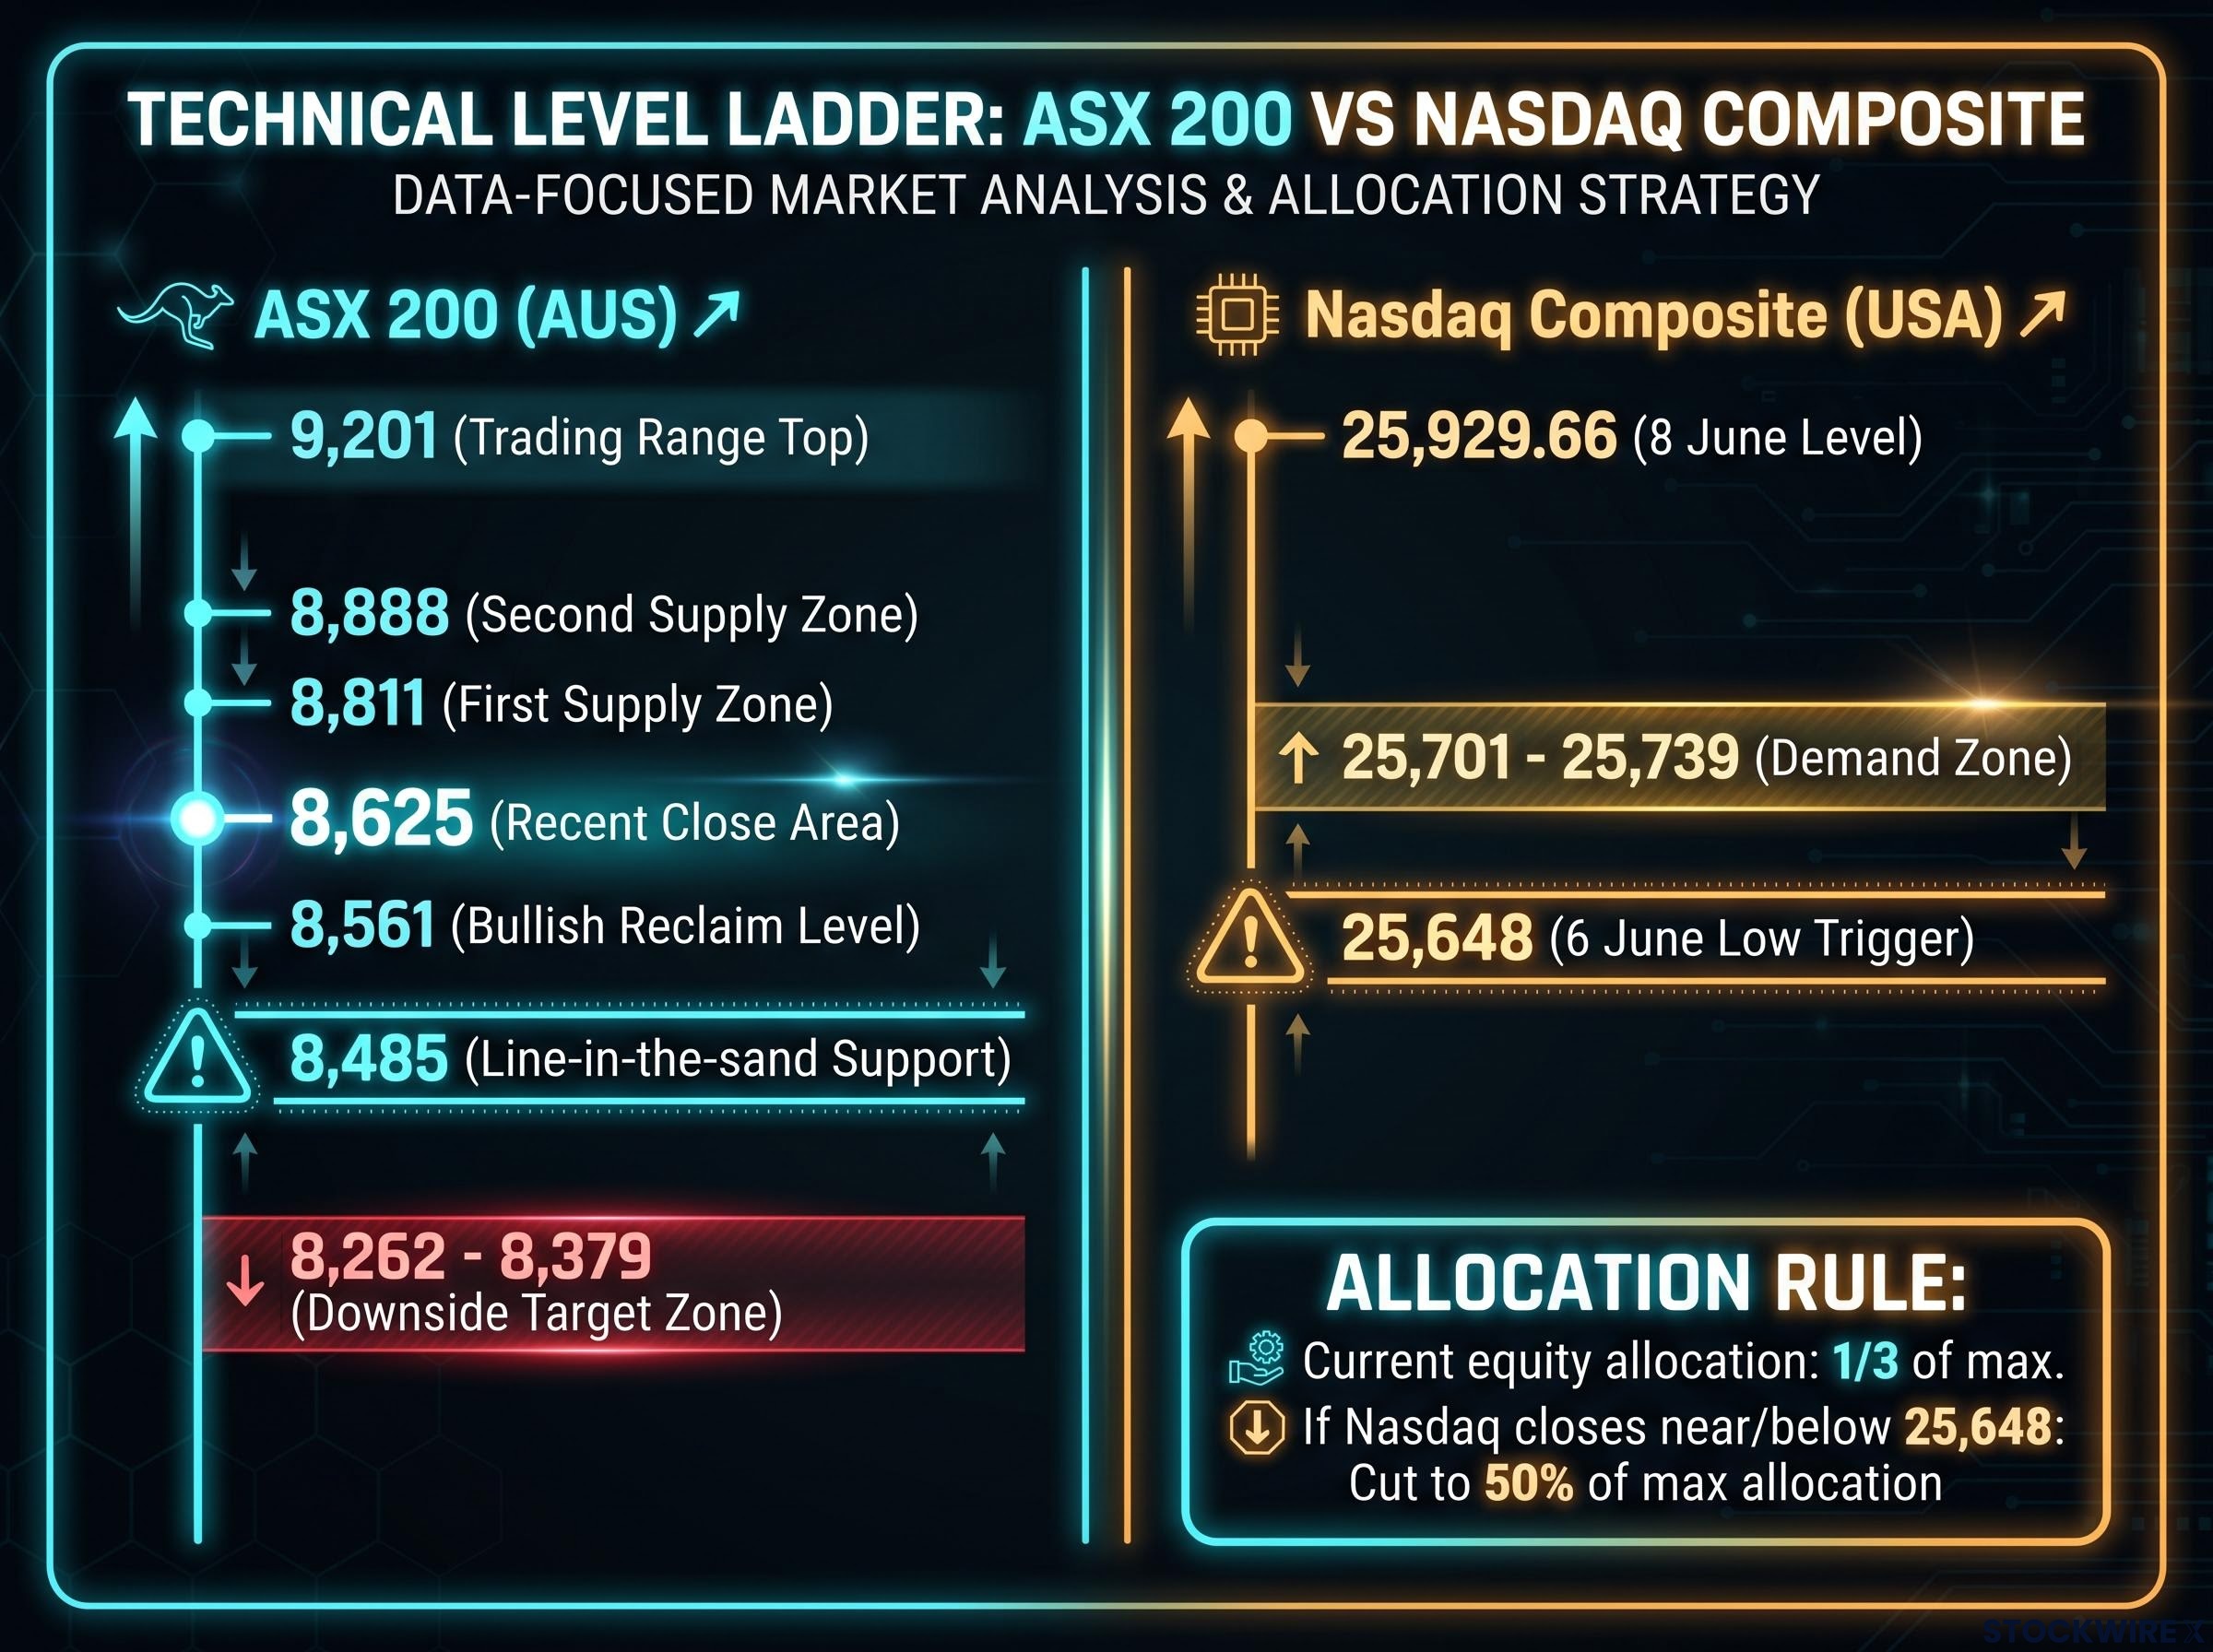
The Nasdaq’s short-term outlook has shifted from bullish to neutral. Friday 6 June saw selling pressure overwhelm buyers, with the index closing below the 25,739 demand reference near the session low. Monday’s session (8 June) failed to recover to even the midpoint of Friday’s decline, leaving the Nasdaq at 25,929.66 with residual excess supply unresolved.
The two defined technical scenarios are:
The ASX 200 posted a constructive intraday response on 9 June, with a long lower shadow on the daily candle indicating strong buying interest near a well-established support zone. Recent closes have been in the 8,625 area.
The line-in-the-sand support sits at 8,485. A break below that level opens a downside target zone of 8,262-8,379. On the upside, the broader trading range extends to 9,201, with the first supply zone at 8,811 and a second at 8,888. The range gives context for how much room exists on either side, and how little buffer remains above that primary support.
Wednesday’s US May CPI release (due 10 June 2026) is the event most likely to determine whether this week resolves bullishly or bearishly for global equities. The April 2026 readings set a firm baseline: headline CPI came in at +0.6% month-on-month and +3.8% year-on-year (the highest since May 2023), with core CPI at +0.4% month-on-month and +2.8% year-on-year. The May core CPI consensus forecast sits at +0.5% month-on-month and +2.9% year-on-year, another firm reading rather than a clean downside break.
The April 2026 CPI shock, which printed at double the consensus monthly forecast and pushed the annual rate to 3.8%, was the event that eliminated near-term Fed rate cut expectations and shifted Wall Street’s first-cut forecasts toward 2027, making the May baseline the most consequential starting point for this week’s data.
The transmission mechanism is direct. CPI shapes Federal Reserve rate expectations, which shape US Treasury yields (the global risk-free rate), which shape equity valuations and the AUD/USD exchange rate. For ASX investors, the read-through touches technology valuations, resource sector currency dynamics, and the overall risk-on or risk-off tone heading into Thursday and Friday.
The Federal Reserve FOMC minutes from April 2026 show the Committee held the federal funds rate target range at 3.5 to 3.75 percent while explicitly flagging elevated uncertainty around the inflation outlook, a posture that makes each incoming CPI print a live input into the rate path rather than a formality.
Research from the Peterson Institute argues that higher tariffs, loose fiscal policy, and tight labour markets make upside inflation surprises more likely than downside through 2026.
| Scenario | Core CPI reading | Fed implications | US yield direction | ASX 200 impact |
|---|---|---|---|---|
| Hot | ≥ 0.6% m/m | Renewed tightening concern; easing hopes deferred | Higher | Retest of 8,485; potential move toward 8,262-8,379 |
| Soft | ≤ 0.3% m/m | Revives hopes of Fed easing later in 2026 | Lower | Move back through 8,561; scope to add risk from one-third of max |
With the Nasdaq already near its critical 25,648 trigger, a hot CPI print could be the catalyst for a break below that level and a mechanical cut to 50% equity allocation.
Thursday is the day the week’s story either coheres into a clear direction or fractures into mixed signals. Two events land within hours of each other, and their combined message matters more than either one in isolation.
The ECB is widely expected to deliver a +0.25 percentage point hike, bringing the Main Refinancing Rate to 2.40% per annum. The rate move itself is largely priced in. What matters is the accompanying guidance: a hawkish message emphasising persistent inflation and further hikes ahead would reinforce a global “higher for longer” narrative, while a dovish tilt focused on growth downside risks would suggest policy is near or at peak tightness.
The ECB March 2026 monetary policy statement shows the Governing Council held the deposit facility rate at 2.00 percent while projecting average headline inflation of 2.6 percent across 2026, a baseline that frames Thursday’s decision as a live question about whether the pace of normalisation accelerates or stalls.
The four CPI-plus-ECB combination outcomes for investors to watch:
May 2026 Core Producer Price Index (PPI) is forecast at +0.5% month-on-month, a meaningful step down from April’s notably elevated +1.0%. PPI is a leading indicator for consumer prices, as producer costs feed through with a lag. A softer core PPI after the firm April reading would be consistent with forecasts that core inflation gradually drifts toward the 2.8-3.0% zone.
PPI above forecast after a hot CPI is an acceleration signal, suggesting inflation pressures are rebuilding up the supply chain. PPI below forecast after a soft CPI is the cleanest confirmation that inflation is contained, a reading that would support equities heading into Friday.
Most retail ASX investors do not watch Treasury auctions. This week, they should. The 30-year auction arrives on Friday after three days of macro data have already tested market nerves, and the trend across recent auctions tells a story of weakening demand that predates any of this week’s events.
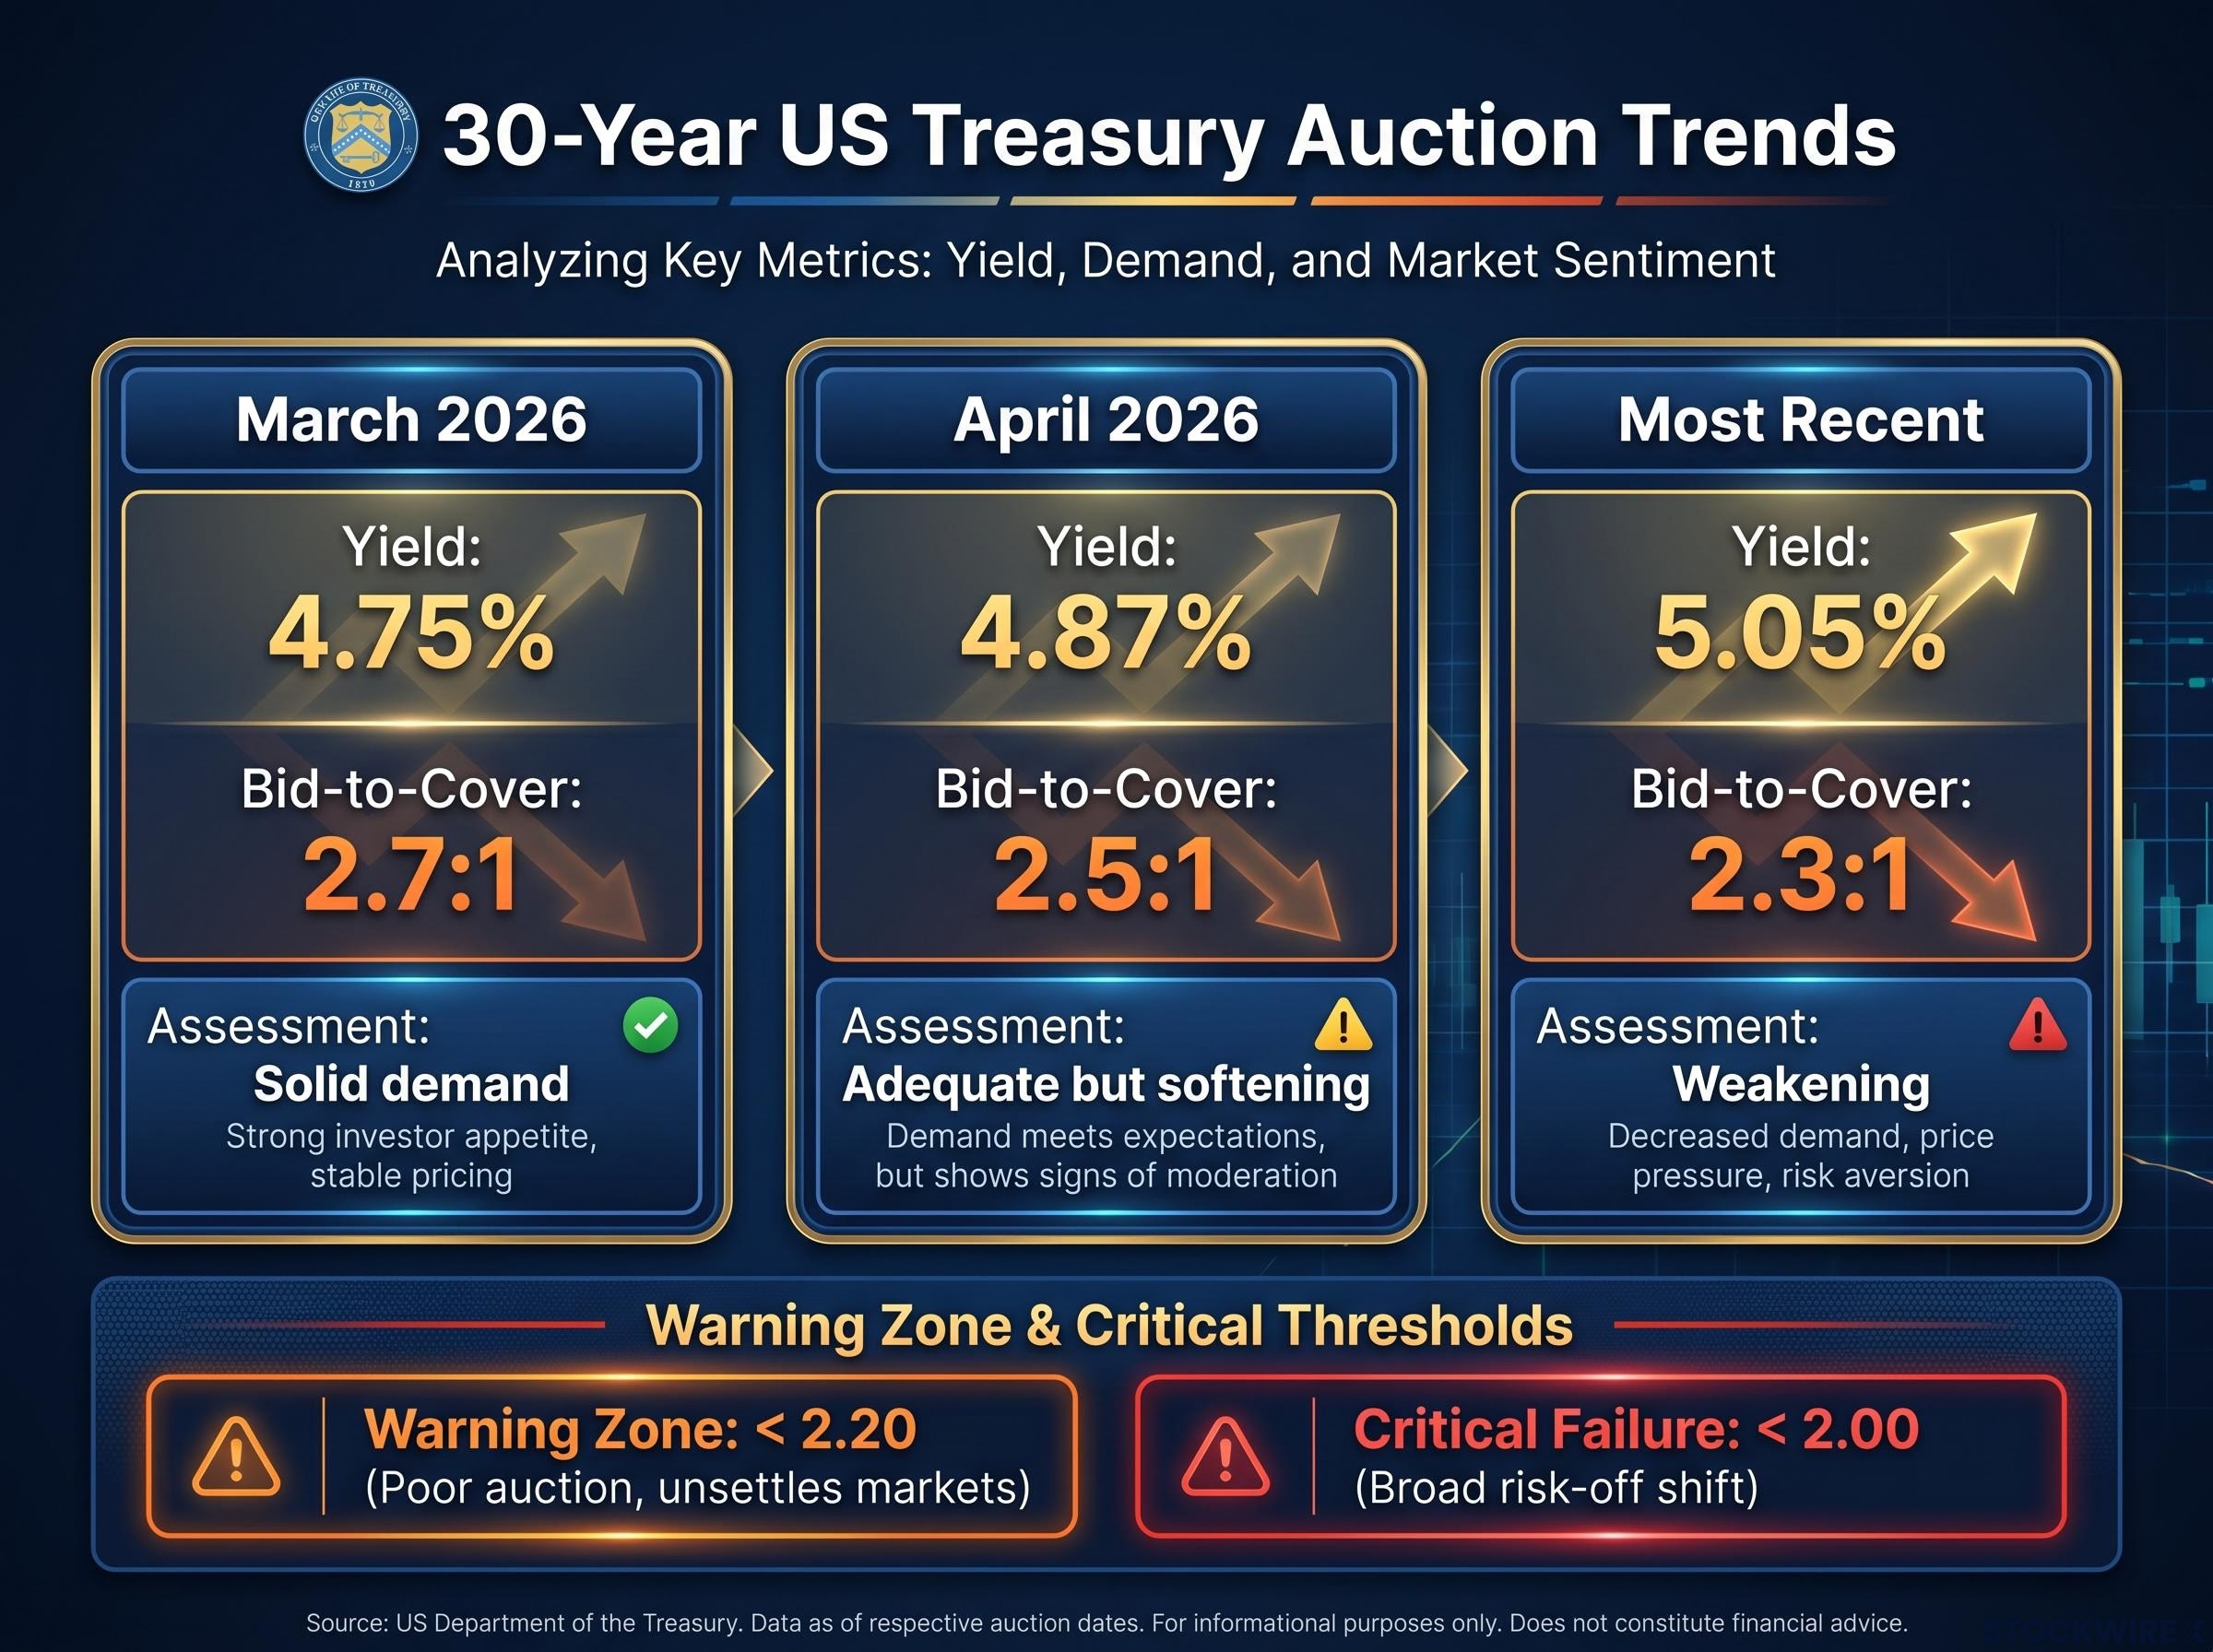
| Auction date | Yield (% p.a.) | Bid-to-cover ratio | Assessment |
|---|---|---|---|
| March 2026 | 4.75% | 2.7:1 | Solid demand |
| April 2026 | 4.87% | 2.5:1 | Adequate but softening |
| Most recent | 5.05% | 2.3:1 | Weakening; approaching poor threshold |
Rising borrowing costs alongside declining bid-to-cover ratios is a pattern that has already drawn attention as a key risk this week.
The 30-year yield dynamics heading into this auction have been building since May 2026, when the yield briefly exceeded 5.19% intraday following the Moody’s sovereign downgrade, pushing Federal Reserve rate hike probability from near zero to approximately 42% in a single month and triggering sector rotation out of materials and consumer discretionary.
A bid-to-cover ratio below 2.00 would be classified as a critical failure, carrying risk of outsized yield moves and a broad risk-off shift across global markets.
A bid-to-cover below 2.20 is classified as a poor auction with the potential to unsettle markets. A weak result pushes global long-term yields higher, raises the equity risk premium, strengthens the USD against the AUD, and weighs hardest on high price-to-earnings growth stocks, REITs (real estate investment trusts), and other duration-sensitive sectors. If this occurs late on Friday US time and the ASX 200 is already hovering near 8,485, the auction outcome could effectively decide whether that support level holds when Australian markets reopen on Monday.
The mechanism connecting US bond yields to Australian share prices runs through three steps:
There is also a currency dimension. When US yields rise, the USD typically strengthens and the AUD weakens. This creates mixed effects across the ASX:
Treasury yield pressure on equity risk premia now functions as a direct policy channel, with Wolfe Research, Bloomberg Opinion, and Apollo each concluding that bond market stress, rather than equity selloffs, is the primary forcing mechanism on White House decision-making, a dynamic that extends the ASX read-through beyond valuation compression into the broader macro policy response.
With US headline CPI at 3.8% year-on-year as of April 2026, the Fed remains in “data-dependent, but patient” mode. J.P. Morgan has flagged the possibility of further ECB and developed-market rate hikes as inflation proves persistent, underscoring why this week’s overseas events translate directly into ASX price action.
The value of pre-mapping scenarios is that each data release this week triggers a check against a known reference point rather than an open-ended reassessment. Three scenario clusters capture the range of outcomes.
| Event | Date | Bearish threshold | Bullish threshold | ASX implication |
|---|---|---|---|---|
| US Core CPI | Wed 10 June | ≥ 0.6% m/m | ≤ 0.3% m/m | Primary catalyst for risk direction all week |
| ECB decision | Thu 11 June | Hawkish guidance | Dovish/balanced guidance | Confirms or contradicts CPI signal |
| US Core PPI | Thu 11 June | Above +0.5% m/m forecast | Below +0.5% m/m forecast | Inflation pipeline confirmation |
| 30-year Treasury auction | Fri 13 June | Bid-to-cover < 2.20 | Bid-to-cover ≥ 2.50 | Sets Monday ASX opening tone |
| Michigan Sentiment | Fri 13 June | Below 44 | Above 46.6 forecast | Secondary factor; compounds auction signal |
On the upside, a close above the first supply zone at 8,811 would be the earliest signal to reassess upside momentum, with 8,888 as the next supply reference. Michigan Sentiment (prior reading: 48.2; May forecast: 46.6) is a secondary factor, but a sharp drop below 44 would add material risk-off pressure on top of a weak auction.
This week’s macro events carry more weight than a routine calendar because both the Nasdaq and the ASX 200 are sitting on support levels with limited margin for error. The data will either confirm that fragility or provide relief.
The discipline that turns this complexity into manageable decision points is straightforward: follow the pre-defined technical levels rather than reacting to headlines. The Nasdaq’s 25,648 on a closing basis and the ASX 200’s 8,485 on intraday tests are the arbiters. If the week delivers a clean bullish cluster, scope to add risk opens gradually. If the bearish cluster materialises, the allocation cuts are already mapped.
A mixed outcome, which remains the most probable result, leaves the technical levels doing the work. Either way, investors who enter Monday with these reference points already in hand are positioned to act on signals rather than scramble to interpret them.
The structural case for reducing ASX home bias extends beyond any single week of macro data: the ASX 200 has underperformed the MSCI World Index by 3-4 percentage points per annum over the decade to December 2025, with Australian investors and SMSFs holding more than 45% of equity exposure in domestic shares despite Australia representing roughly 2% of global market capitalisation.
This article is for informational purposes only and should not be considered financial advice. Investors should conduct their own research and consult with financial professionals before making investment decisions. Past performance does not guarantee future results. Financial projections are subject to market conditions and various risk factors.
As of 9 June 2026, recommended Australian equity risk allocation stands at one-third of maximum allowable, reflecting a fragile technical chart structure on the ASX 200 rather than a discretionary preference, with the index sitting just above a critical support level at 8,485.
US CPI shapes Federal Reserve rate expectations, which move US Treasury yields (the global risk-free rate), which in turn affect equity discount rates, price-to-earnings multiples, and the AUD/USD exchange rate, all of which feed directly into ASX valuations and sector returns.
The two key levels are the ASX 200 intraday support at 8,485, where a break lower opens a downside target zone of 8,262-8,379, and the Nasdaq Composite closing level of 25,648, which if breached would trigger a pre-defined reduction to 50% of maximum equity allocation.
A weak auction forces the US government to offer higher yields to attract buyers, pushing global long-term rates higher, compressing equity valuations, strengthening the USD against the AUD, and weighing hardest on growth stocks, REITs, and other duration-sensitive ASX sectors.
The cleanest bullish scenario is a soft US CPI reading at or below 0.3% month-on-month, a dovish ECB tone, a soft core PPI, and a 30-year Treasury auction bid-to-cover ratio at or above 2.50, which together would support the Nasdaq reclaiming its demand zone and open scope for ASX investors to gradually add equity risk.


