Why Franking Credits Change Every NAB Dividend Discount Model
9 hrs ago

Most retail investors who own bank stocks have never read a net interest margin figure. The Big Four banks sit in nearly every Australian equity portfolio, held for their franked dividends and perceived safety, yet the analytical step between “buy the biggest name” and “understand what you own” is one most shareholders skip entirely. That assumption carries risk. NAB’s 1H26 results, released on 4 May 2026, offer a current set of numbers that bring three bank-specific metrics to life with real data. By the end of this guide, readers will understand the three metrics that matter most when evaluating an ASX bank stock, what each number reveals (and what it does not), and how to use NAB’s latest figures to benchmark any bank in the sector.
Banks sell money. Their core product is the spread between what they charge borrowers and what they pay depositors, which makes their revenue, cost, and risk structures fundamentally unlike those of an industrial or consumer company. Attempting to analyse a bank using the same toolkit applied to a retailer or a mining company produces misleading conclusions before the analysis even begins.
Consider what conventional metrics miss when applied to banks:
For NAB, lending activity generated approximately 81% of total income in the most recent full financial year. That single figure illustrates why margin analysis dominates bank evaluation: the overwhelming majority of income flows through a single channel that conventional equity metrics were not designed to measure.
All four Big Four banks operate under APRA (the Australian Prudential Regulation Authority), which dictates both what they can do with capital and how they must report it. This regulatory overlay shapes every metric that follows.
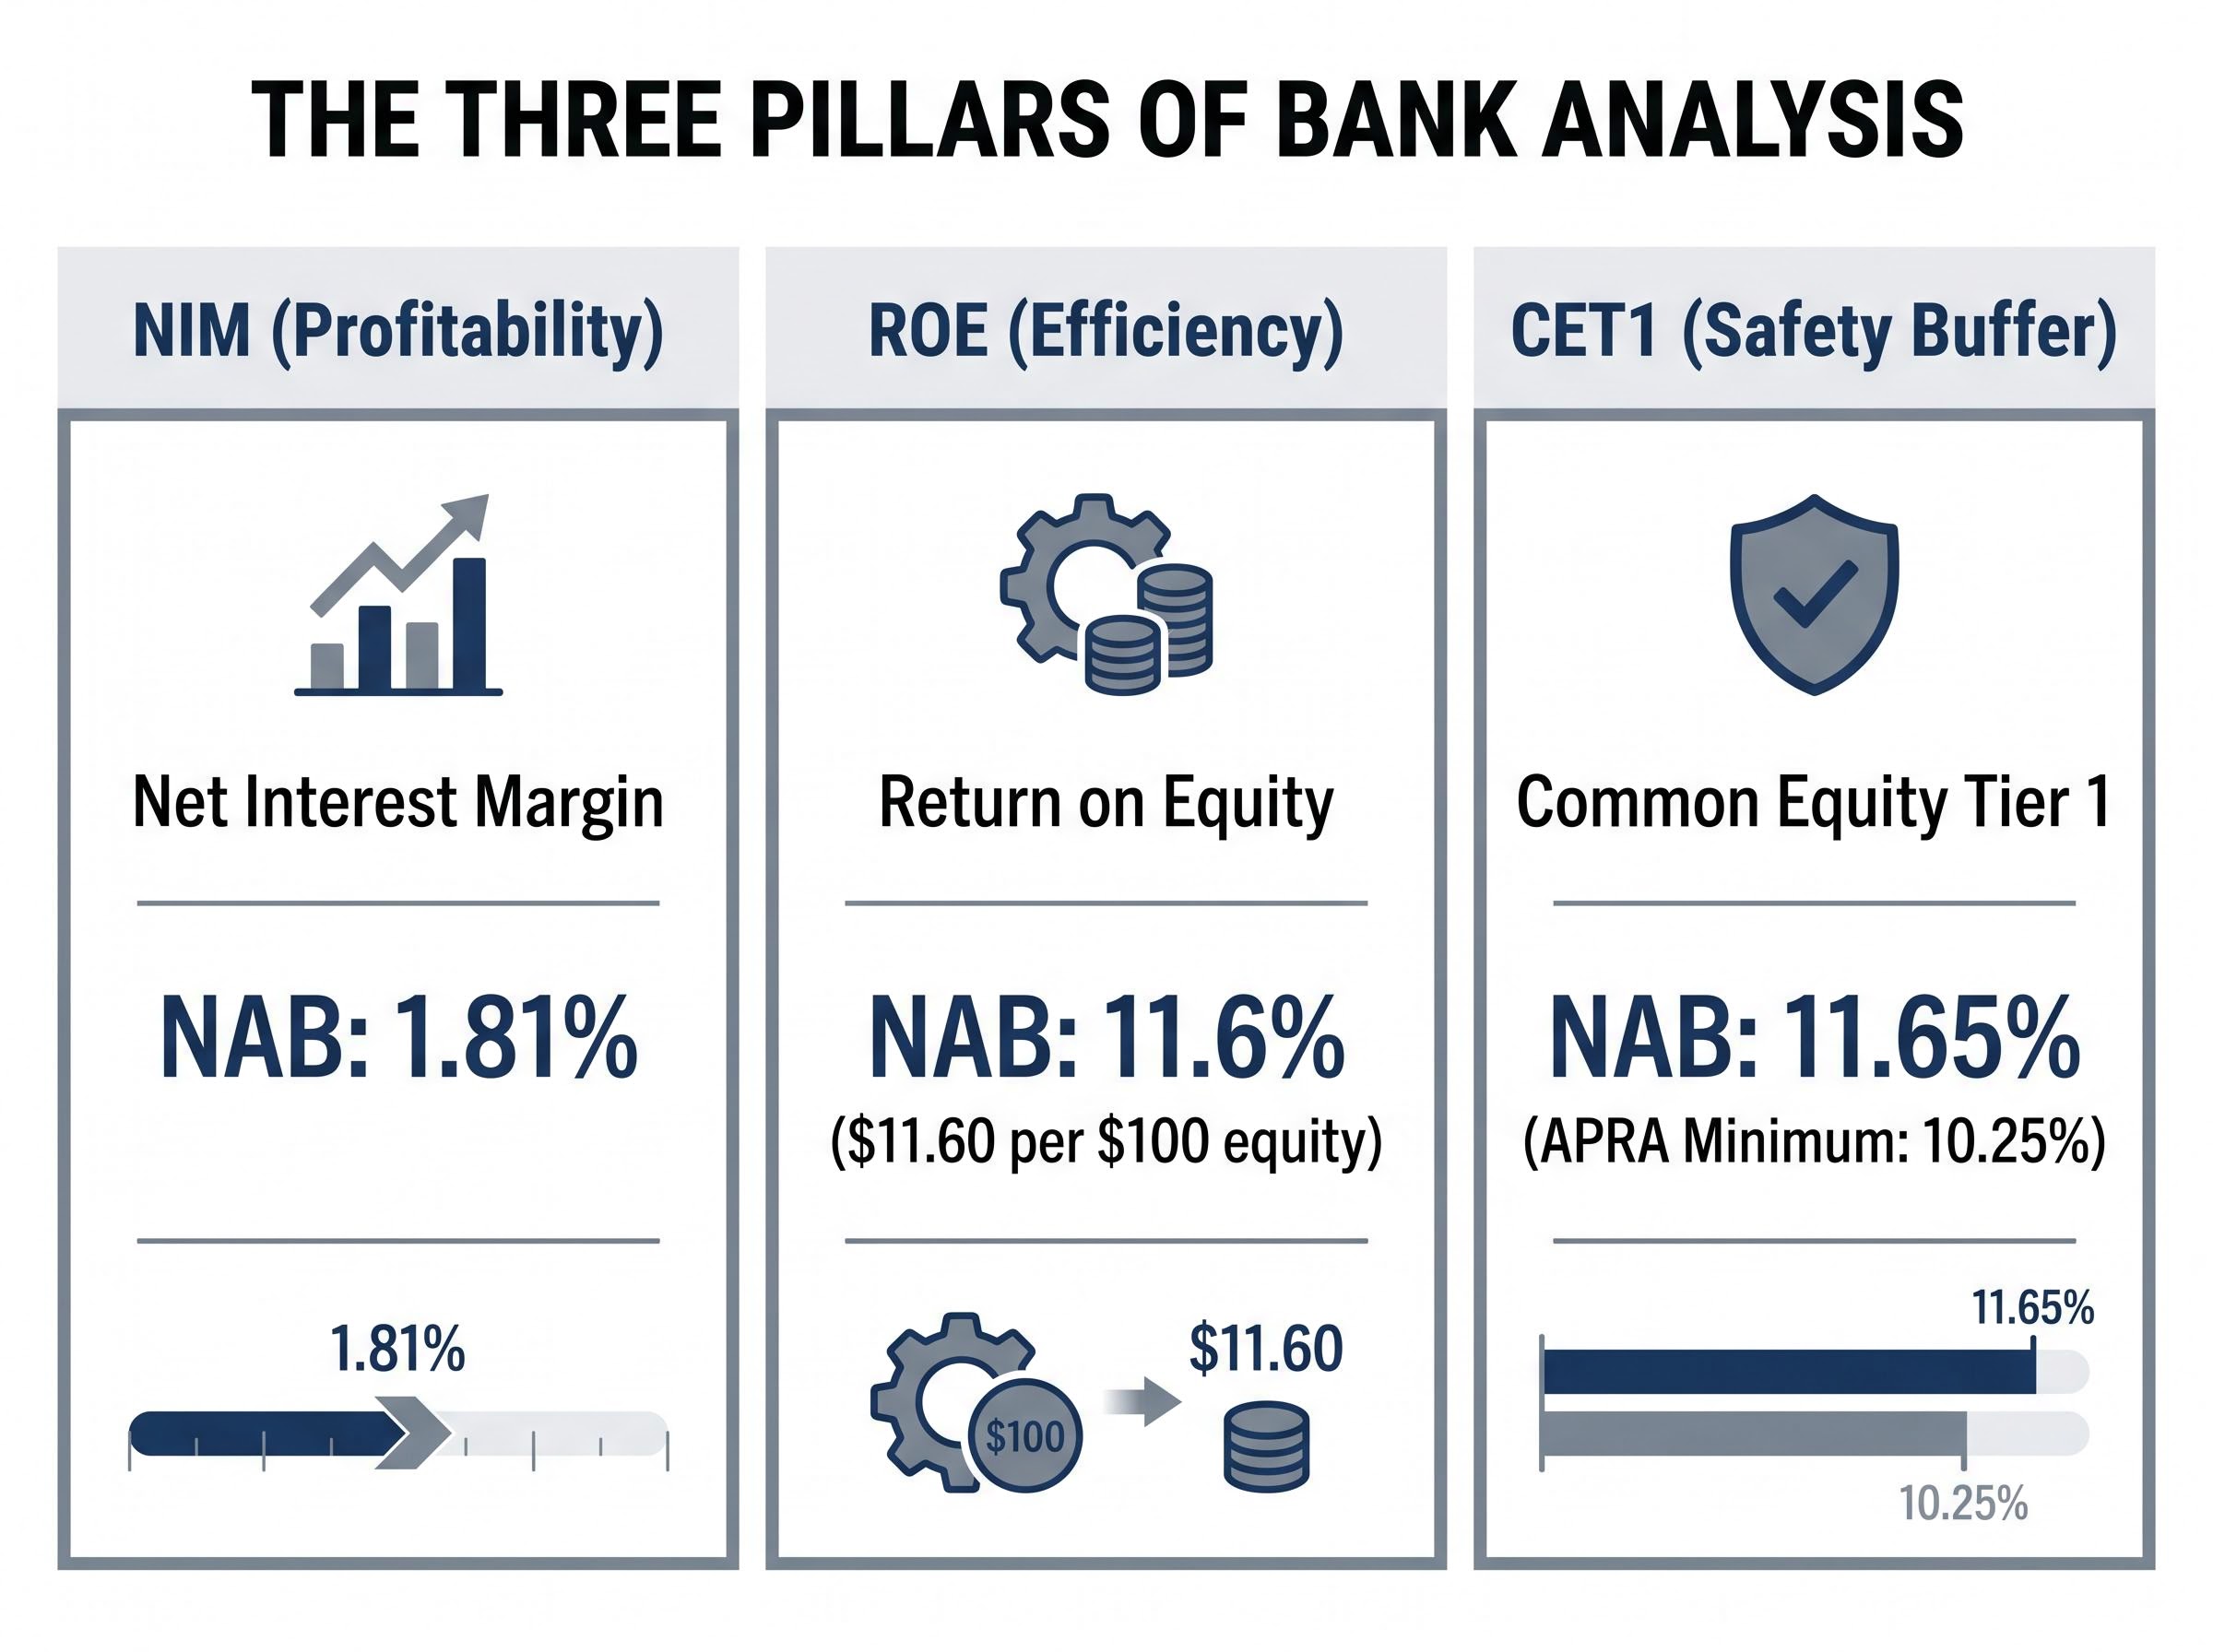
Three figures form the analytical core of any bank assessment. Net interest margin (NIM) measures how much profit a bank earns on every dollar it lends. Return on equity (ROE) measures how efficiently the bank converts shareholder capital into profit. The Common Equity Tier 1 (CET1) ratio measures how thick the safety buffer is between the bank and financial distress.
Each metric answers a different question. Together, they provide a three-dimensional view of profitability, efficiency, and resilience.
A bank borrows money (through deposits and wholesale funding) at one interest rate and lends it out at a higher one. The gap between those two rates, expressed as a percentage of interest-earning assets, is the net interest margin. A wider NIM means greater profitability per dollar lent. A narrowing NIM signals that competitive pressure on mortgage pricing, deposit rates, or both is compressing the bank’s core revenue engine.
Why NIM carries outsized weight: With lending income representing approximately 81% of NAB’s total income, even a small shift in NIM ripples through the entire profit line at scale.
NAB’s NIM of 1.81% in 1H26 sits below CBA’s 2.04% but above ANZ’s 1.53%. That 23-basis-point gap between NAB and CBA might appear modest in percentage terms. At scale, across hundreds of billions in interest-earning assets, it represents a material difference in earnings power. Westpac sits between the two at 1.95%.
The following table compares the Big Four on this measure. Note that reporting periods differ slightly across banks due to different financial year-ends.
| Bank | NIM | Reporting Period |
|---|---|---|
| CBA | 2.04% | 1H26 (Dec 2025) |
| WBC | 1.95% | FY2025 (Sep 2025) |
| NAB | 1.81% | 1H26 (Mar 2026) |
| ANZ | 1.53% | 1H26 (Mar 2026) |
A retail investor who tracks NIM across two or three reporting periods can quickly identify whether a bank is defending its margins or losing pricing power. A single half-year figure is informative; a trend across three or four periods is where the real signal emerges.
ROE answers the opportunity cost question every shareholder should be asking: could the capital tied up in this bank earn a better return elsewhere? Return on equity is calculated by dividing net profit by total shareholder equity, expressed as a percentage. It measures how efficiently a bank converts its equity base into earnings.
NAB’s cash ROE of 11.6% (excluding notable items) in 1H26 translates to a concrete figure: the bank generates $11.60 in annual profit for every $100 of shareholder equity. That places NAB above both ANZ at 10.6% and WBC at 9.7%, but below CBA at 13.8%, which leads the sector on this measure.
| Bank | Cash ROE | Reporting Period |
|---|---|---|
| CBA | 13.8% | 1H26 (Dec 2025) |
| NAB | 11.6% | 1H26 (Mar 2026) |
| ANZ | 10.6% | 1H26 (Mar 2026) |
| WBC | 9.7% | FY2025 (Sep 2025) |
ROE figures across the Big Four are reported on a cash basis, and definitions may vary slightly between banks. That caveat matters when making direct comparisons.
Three ways to use ROE in the analysis:
Used alongside NIM, ROE gives investors a two-dimensional view: revenue efficiency and capital efficiency measured together.
The Common Equity Tier 1 ratio measures the proportion of a bank’s risk-weighted assets funded by the highest-quality capital, primarily retained earnings and ordinary shares. It is the primary buffer against financial distress, the metric that determines whether a bank can absorb a credit shock, sustain its dividend, and continue lending through a downturn.
The regulatory floor: APRA’s current minimum CET1 requirement for major Australian banks is 10.25% (on an APRA Level 2 basis, inclusive of applicable capital buffers). All four Big Four banks currently sit comfortably above this threshold.
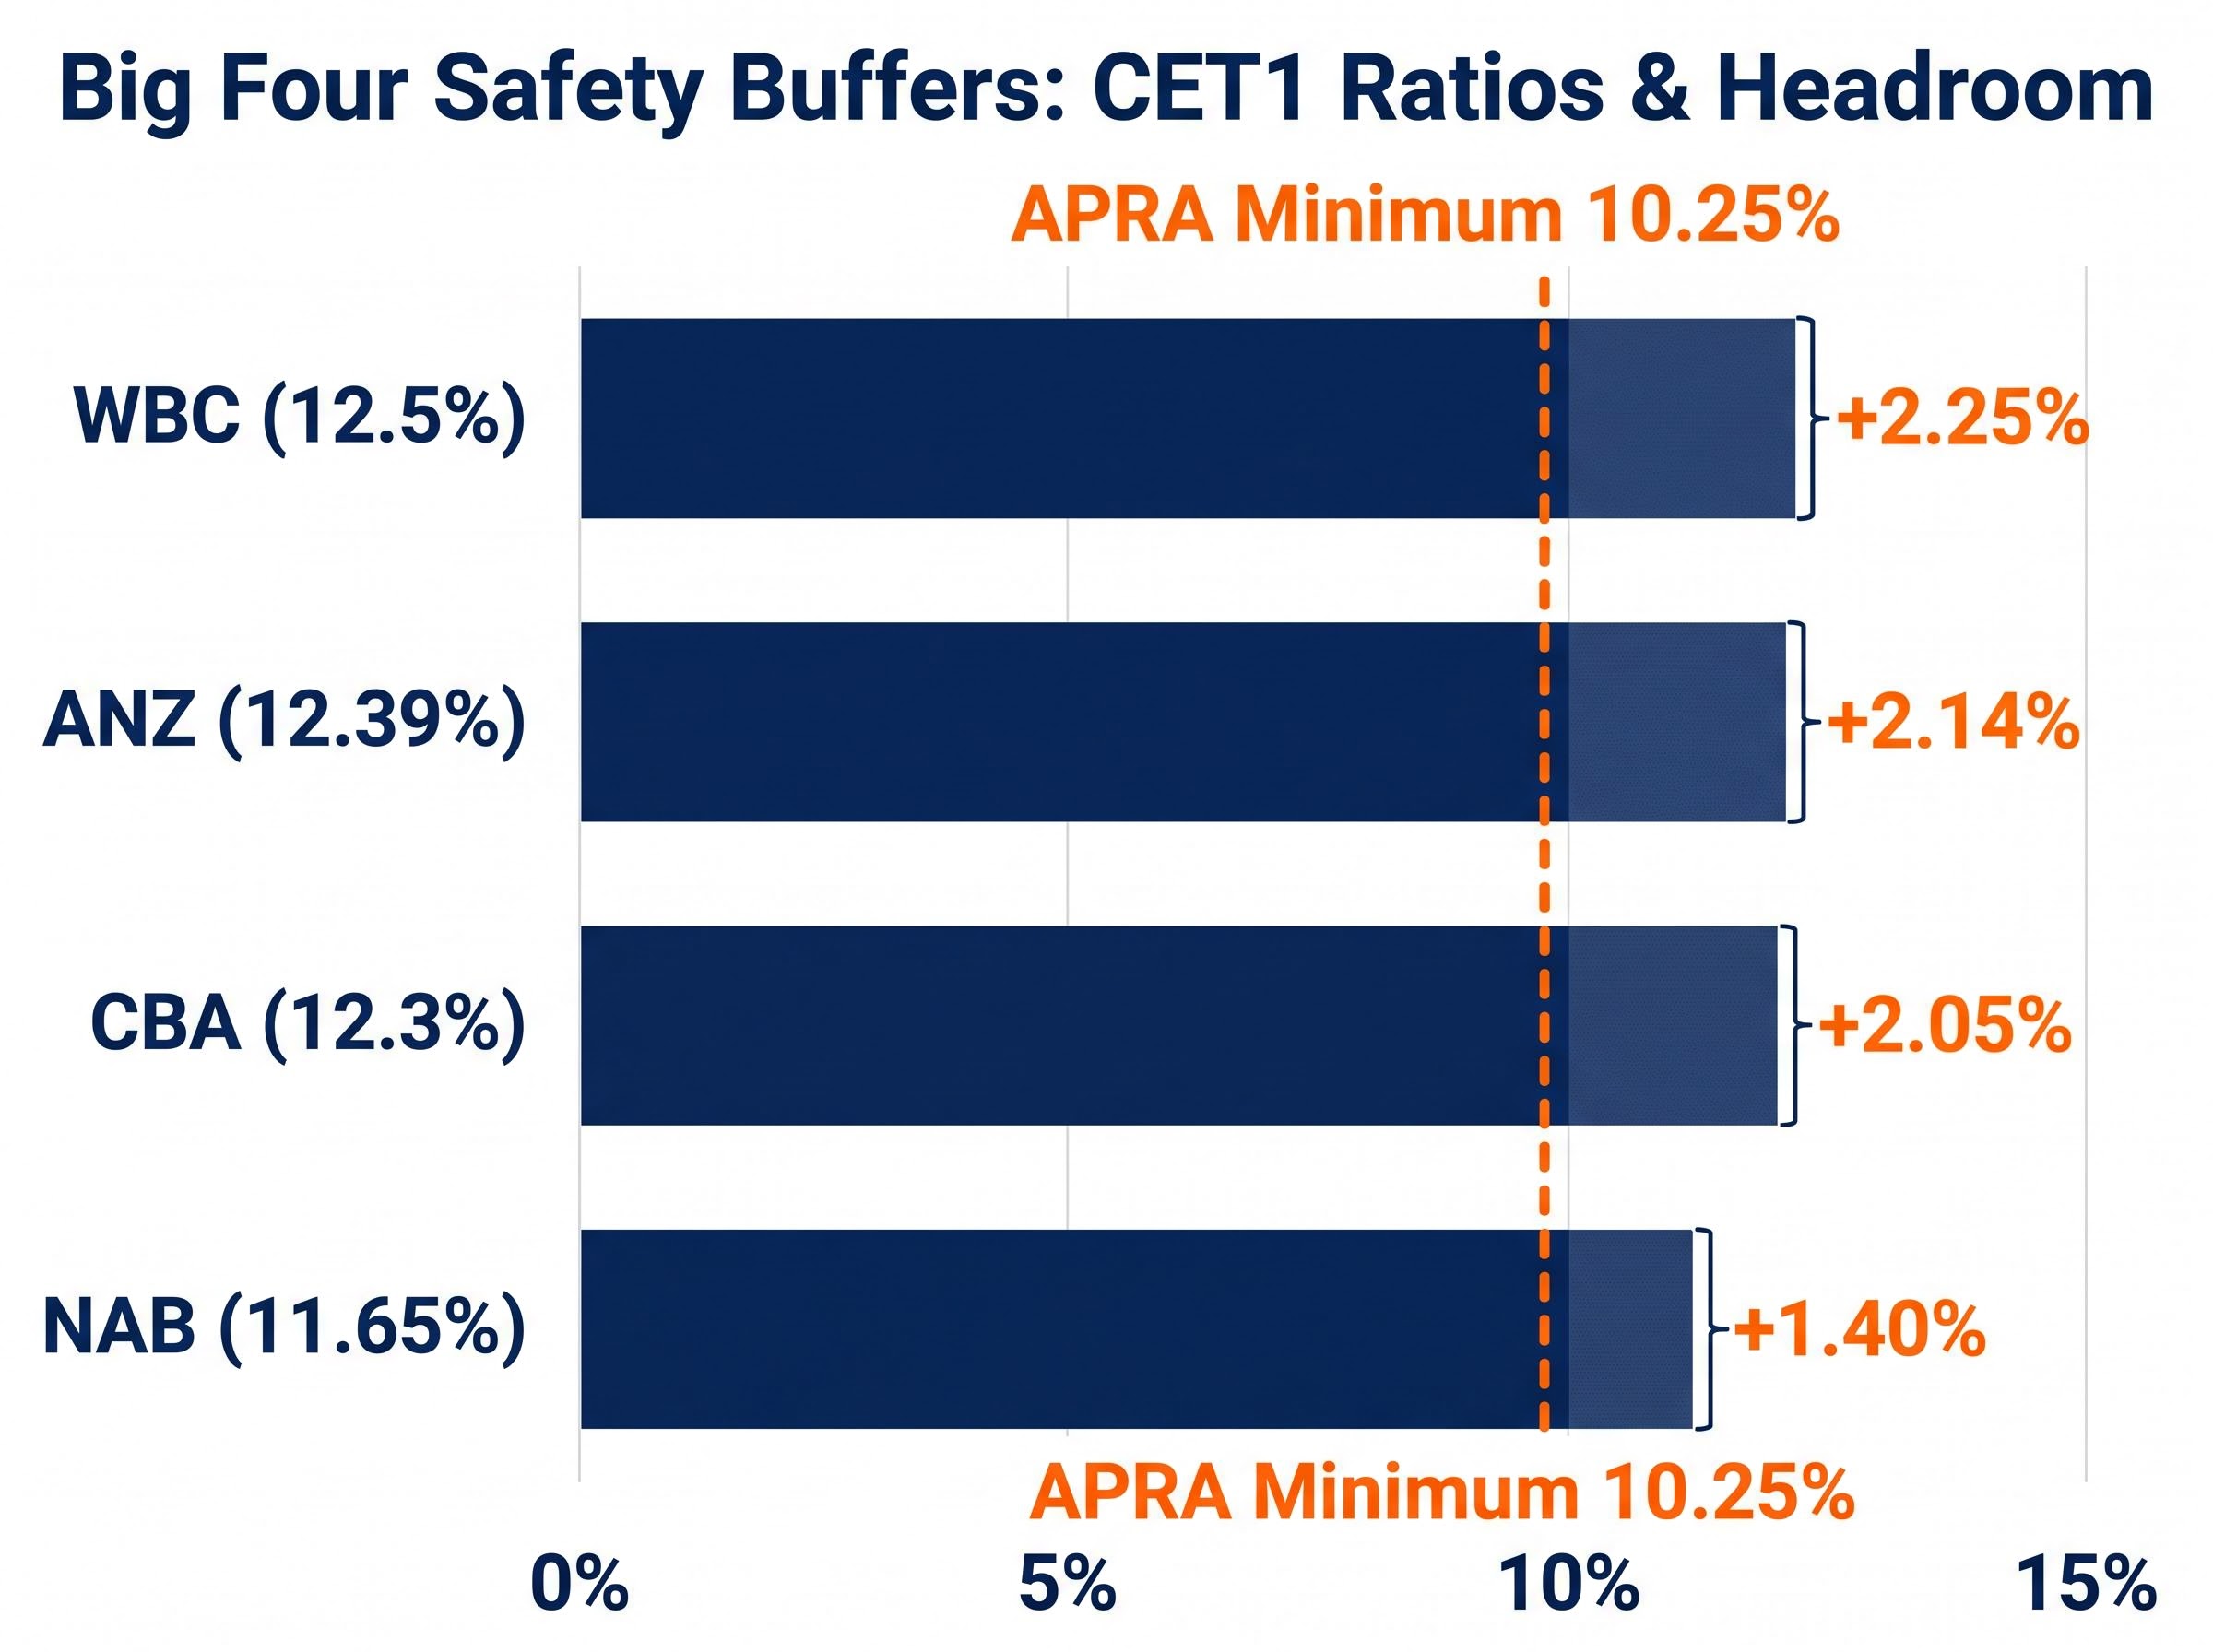
NAB’s reported CET1 of 11.65% (with a pro forma 12.05% after announced capital actions) represents 140 basis points of headroom above the APRA minimum. That is the thinnest margin among the Big Four on a reported basis, though it remains well within prudential expectations.
| Bank | CET1 Ratio | APRA Minimum | Headroom | Period |
|---|---|---|---|---|
| WBC | 12.5% | 10.25% | 2.25% | FY2025 (Sep 2025) |
| ANZ | 12.39% | 10.25% | 2.14% | 1H26 (Mar 2026) |
| CBA | 12.3% | 10.25% | 2.05% | 1H26 (Dec 2025) |
| NAB | 11.65% | 10.25% | 1.40% | 1H26 (Mar 2026) |
A higher CET1 provides greater resilience and optionality, including the capacity for dividends and buybacks. However, a ratio running persistently well above peers could also signal under-leveraged capital deployment, meaning the bank is holding more capital than it needs to at the expense of shareholder returns.
CET1 should not be read in isolation from a bank’s dividend payout ratio. A bank running thin on capital headroom may face pressure to cut or defer distributions, even if current earnings support the payout. Investors holding bank stocks primarily for income should monitor the relationship between headroom and payout closely.
A structural change is also approaching. APRA finalised the removal of Additional Tier 1 (AT1) capital instruments from the regulatory capital framework in December 2025, with the phase-out taking effect on 1 January 2027. This means the Big Four will need to adjust how they manage their capital structures, likely replacing AT1 instruments with other forms of capital. The CET1 ratio will become an even more important metric to watch as banks navigate this transition.
The three metrics work as a system. NIM measures revenue quality: how much the bank earns per dollar lent. ROE measures capital efficiency: how productively management deploys shareholder equity. CET1 measures balance sheet resilience: how thick the buffer is between the bank and a crisis. A bank that scores well on one metric but poorly on another deserves closer scrutiny, not a pass.
NAB’s 1H26 profile illustrates this dynamic. Its NIM of 1.81% sits below CBA but above ANZ, reflecting competitive mortgage pricing pressure partially offset by strong business lending volumes (approximately $260.5 billion in Australian business lending as at March 2026, representing roughly 21.5-21.8% market share). Its ROE of 11.6% places it in the mid-range of the sector. Its reported CET1 of 11.65% is the lowest of the four on a reported basis but sits above the APRA floor, with the pro forma figure of 12.05% narrowing the gap.
No single metric makes a bank a buy or a sell. The value is in reading them together.
A five-step process for evaluating an ASX bank stock at results time:
Once the three-metric framework is familiar, additional metrics worth investigating include:
The metrics covered in this guide are drawn directly from publicly available ASX announcements and investor presentations. No Bloomberg terminal or broker subscription is required. Any retail investor can access the same data used by institutional analysts.
The greater discipline is tracking these metrics across multiple reporting periods for each bank rather than reacting to a single half-year result. Trends are more informative than snapshots. NAB announced its 1H26 results on 4 May 2026. ANZ reported on 1 May 2026. CBA’s 1H26 results were released on 11 February 2026. Understanding this staggered reporting cycle is itself part of the analytical practice.
Where to find the source data:
Investors should always verify the most recent ASX announcement before acting on any metric cited in commentary or analysis. Figures can be restated, and reporting definitions may change between periods.
NAB’s 1H26 results present a profile that resists simple characterisation. A below-peer NIM offset by sector-leading business lending volumes. A mid-range ROE that neither leads nor lags by a wide margin. A CET1 ratio that sits above the regulatory floor but carries the thinnest headroom among the Big Four on a reported basis.
That complexity is the point. No single metric captures a bank’s investment case. The analytical value lies in reading the three together, tracking them over time, and understanding what the interaction between them reveals about a bank’s competitive position and risk profile.
As NAB and its peers move toward the 2027 APRA capital framework changes, the CET1 metric in particular will be worth monitoring closely. The banks that manage this transition most effectively will likely be the ones whose three-metric profiles look strongest on the other side.
This article is for informational purposes only and should not be considered financial advice. Investors should conduct their own research and consult with financial professionals before making investment decisions.
Net interest margin (NIM) is the difference between the interest rate a bank charges borrowers and the rate it pays depositors, expressed as a percentage of interest-earning assets. It is the primary measure of a bank's core revenue efficiency, and even small changes in NIM can have a material impact on profits at the scale of a major bank.
The CET1 ratio measures the proportion of a bank's risk-weighted assets funded by its highest-quality capital, such as retained earnings and ordinary shares. Investors compare it against APRA's minimum requirement of 10.25% for major Australian banks; the gap between a bank's reported CET1 and that floor indicates how much buffer it has to absorb losses, sustain dividends, and continue lending through a downturn.
Return on equity (ROE) measures how much profit a bank generates for every dollar of shareholder equity, expressed as a percentage. Among the Big Four, CBA leads at 13.8%, followed by NAB at 11.6%, ANZ at 10.6%, and Westpac at 9.7%, giving investors a direct peer benchmark for capital efficiency.
All three metrics are disclosed in each bank's half-year and full-year results, available as ASX company announcements and investor presentations on the ASX website or each bank's investor relations page. APRA's Monthly ADI Statistics and KPMG's Big Four bank results summaries also provide consolidated sector-level comparisons.
NAB reported a NIM of 1.81% for 1H26 (March 2026), placing it below CBA at 2.04% and Westpac at 1.95%, but above ANZ at 1.53%, reflecting competitive mortgage pricing pressure partially offset by strong business lending volumes.