Why Franking Credits Change Every NAB Dividend Discount Model
9 hrs ago

ANZ shares closed at $35.50 on 24 May 2026, landing almost exactly on the $35.10 average fair value produced by a dividend discount model run across a full matrix of growth and discount rate scenarios. That kind of alignment between market price and model output is uncommon, and it makes this a genuinely instructive moment for anyone trying to judge whether a big-four bank stock is cheap, fair, or expensive.
The dividend discount model (DDM) is one of the most intuitive valuation tools available for Australian bank stocks. Banks pay large, relatively predictable dividends, which makes them natural candidates for the method. But inputs matter enormously. Choosing the wrong growth rate or discount rate can shift the fair value estimate on the same stock from $18 to $84.
This guide walks through how to build a DDM valuation for ANZ using real, current data, explains what the scenario outputs mean in practice, addresses the franking credit adjustment that Australian investors cannot afford to overlook, and flags the model’s limitations so readers can apply the same framework to any ASX bank stock with clear-eyed judgment.
Why does the DDM work particularly well for bank stocks? The answer sits in what banks actually do with their earnings.
A DDM values a share as the present value of all future dividends, discounted back at a required rate of return that reflects the riskiness of the investment. For companies that retain most of their earnings and reinvest aggressively, dividends are a poor proxy for value. For mature, regulated businesses like ANZ, where interest income from lending represented 78% of total revenue in the most recent full financial year, dividends are a reasonably faithful proxy for distributable earnings.
ANZ paid a total dividend of $1.66 per share in both FY24 (84 cents interim plus 82 cents final, fully franked) and FY25 (83 cents interim plus 83 cents final, 70% franked). High payout ratios sustained across multiple years are precisely what makes the single-stage DDM, known as the Gordon Growth Model, the version most commonly applied to ASX bank stocks.
The Gordon Growth Model applies most cleanly to businesses with stable, regulated earnings and established payout histories, which is precisely why the DDM for ASX income stocks is most commonly demonstrated using banks, REITs, and utilities rather than technology or resources companies whose dividend trajectories are far less predictable.
The Gordon Growth Model requires three inputs:
Gordon Growth Model formula: D1 / (r – g) = Estimated fair value per share
Understanding why the model suits banks, and when it does not, is the conceptual foundation needed before any numbers are plugged in. Without it, the scenario outputs that follow appear arbitrary.
Each input in a DDM is a judgment call, and each carries asymmetric consequences. A growth rate that is one percentage point too high can overstate fair value by $5-$10 per share on a stock like ANZ. The three inputs deserve individual attention.
Dividend (D0). The base dividend is the most recent confirmed full-year figure: $1.66 per share for FY25. Applying the chosen growth rate to this figure produces D1, the forward dividend used in the formula.
Growth rate (g). The FY24-to-FY25 dividend trajectory was flat at $1.66 both years. Analyst consensus for FY26 sits at approximately 168 cents per share, implying roughly 1.2% growth. The macro context constrains payout expansion: ANZ’s net interest margin (NIM) of 1.57% sits below the major-bank average of 1.78%, and mortgage competition continues to compress margins. A reasonable scenario range spans 2% to 4%, capturing both a conservative view and a mildly optimistic one.
Required return (r). The starting point is the risk-free rate: the 10-year Australian government bond yield, which stood at approximately 4.92% on 22 May 2026. Three components build the full required return:
ANZ’s CET1 capital ratio of 12.39% at 31 March 2026 sits above APRA’s “unquestionably strong” benchmark, providing dividend support. Return on tangible equity recovered to 11.6% in H1 FY26, up from an FY24 return on equity (ROE) of 9.3%. These metrics inform where the required return should sit within a plausible range.
APRA’s unquestionably strong capital framework sets out the benchmark CET1 ratios that major Australian banks are expected to maintain, with the regulator anticipating that the big four operate above 11% from 2023 onward, a threshold ANZ’s current 12.39% CET1 ratio comfortably clears.
| Input | Conservative case | Base case | Aggressive case |
|---|---|---|---|
| D0 (base dividend) | $1.66 | $1.66 | $1.66 |
| Assumed g (growth rate) | 2% | 3% | 4% |
| r (required return) | 10% | 8.5% | 7% |
| D1 (implied forward dividend) | $1.69 | $1.71 | $1.73 |
The full scenario matrix produces DDM valuations ranging from approximately $18.78 (high discount rate, low growth) to $84.50 (low discount rate, high growth). The simple average across all combinations is $35.10. That spread is wide enough to seem unhelpful at first glance, and that is precisely the point.
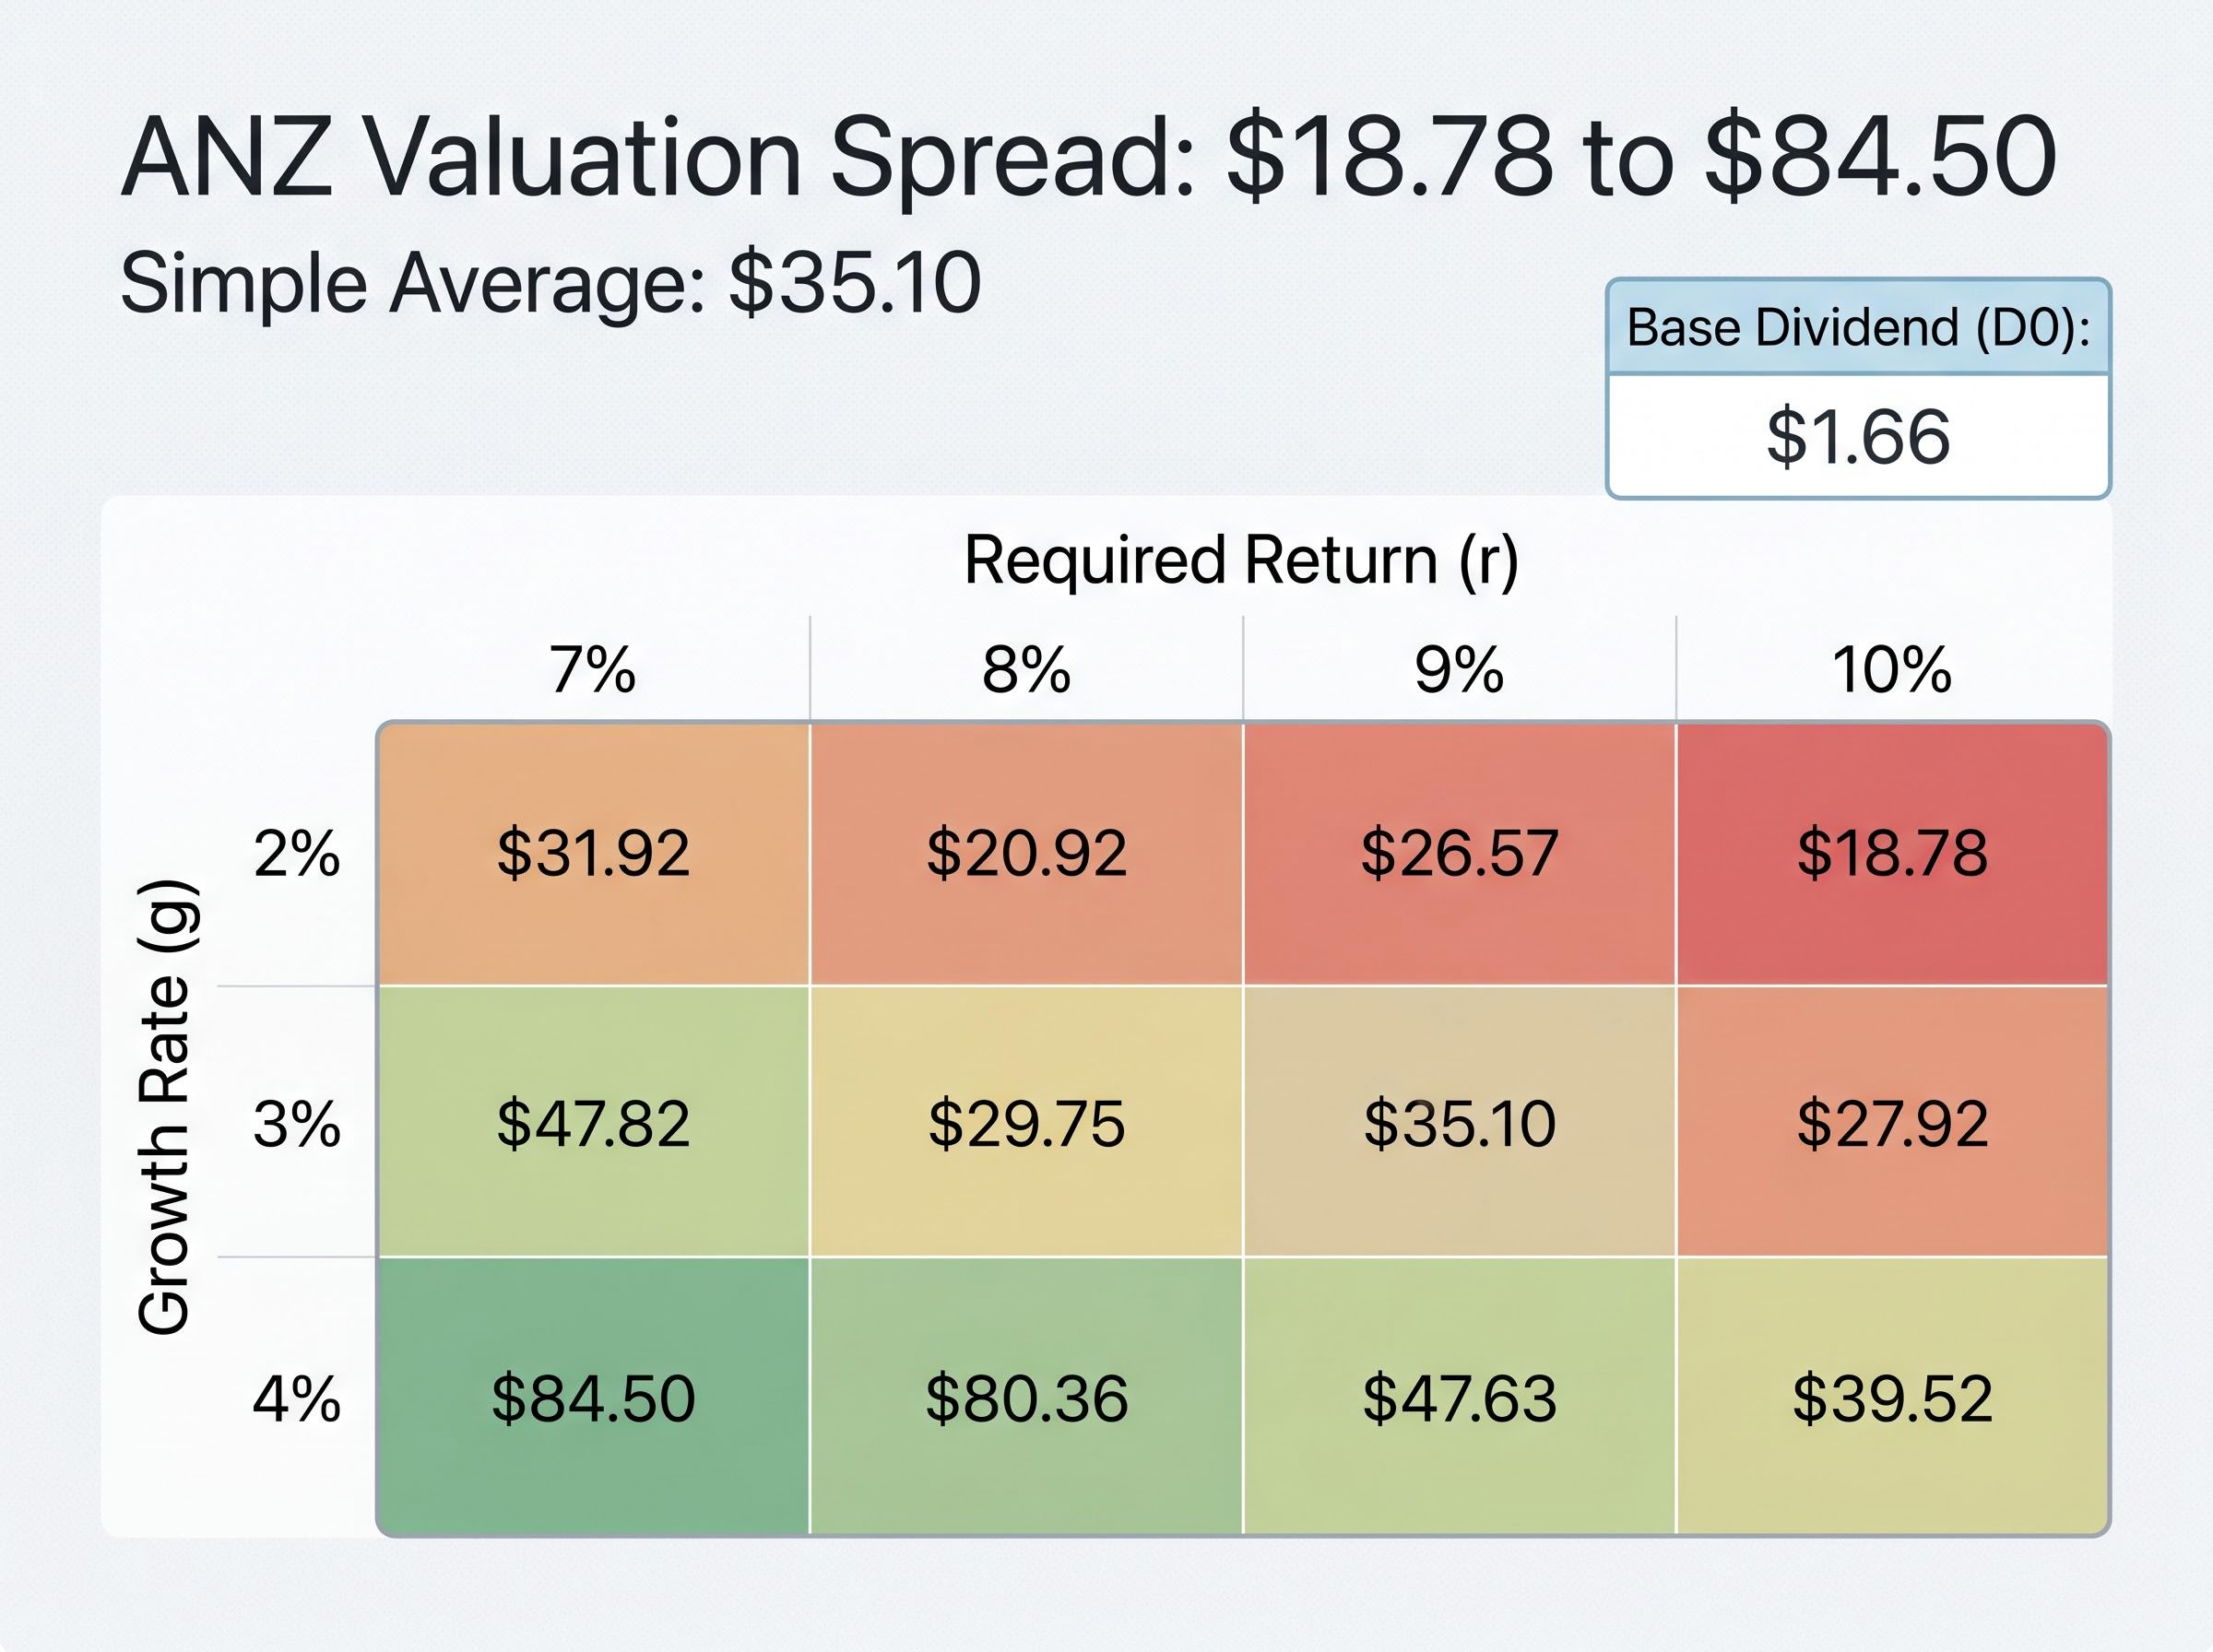
The extremes exist because the model is doing exactly what it should: revealing how sensitive fair value is to assumptions. A 2% growth rate paired with an 11% discount rate implies near-zero real earnings growth and a punishing required return, a scenario that would only hold if ANZ faced a structural deterioration in its business model. A 4% growth rate paired with a 6% discount rate implies a return to the ultra-low-rate environment of 2019-2021, which the current 4.92% bond yield directly contradicts.
| Growth rate (g) | r = 7% | r = 8% | r = 9% | r = 10% |
|---|---|---|---|---|
| 2% | $33.86 | $28.22 | $24.19 | $21.17 |
| 3% | $42.77 | $34.20 | $28.50 | $24.43 |
| 4% | $57.53 | $43.16 | $34.53 | $28.78 |
The middle scenarios deserve the most attention. With a 10-year bond yield near 4.9%, a recovering but not exceptional ANZ ROE of 11.6%, and a NIM that trails the peer average, required return assumptions in the 8%-9% range paired with growth of 2%-3% produce the most analytically defensible outputs. Those cells cluster around $28-$34, overlapping with the lower half of the broker consensus band.
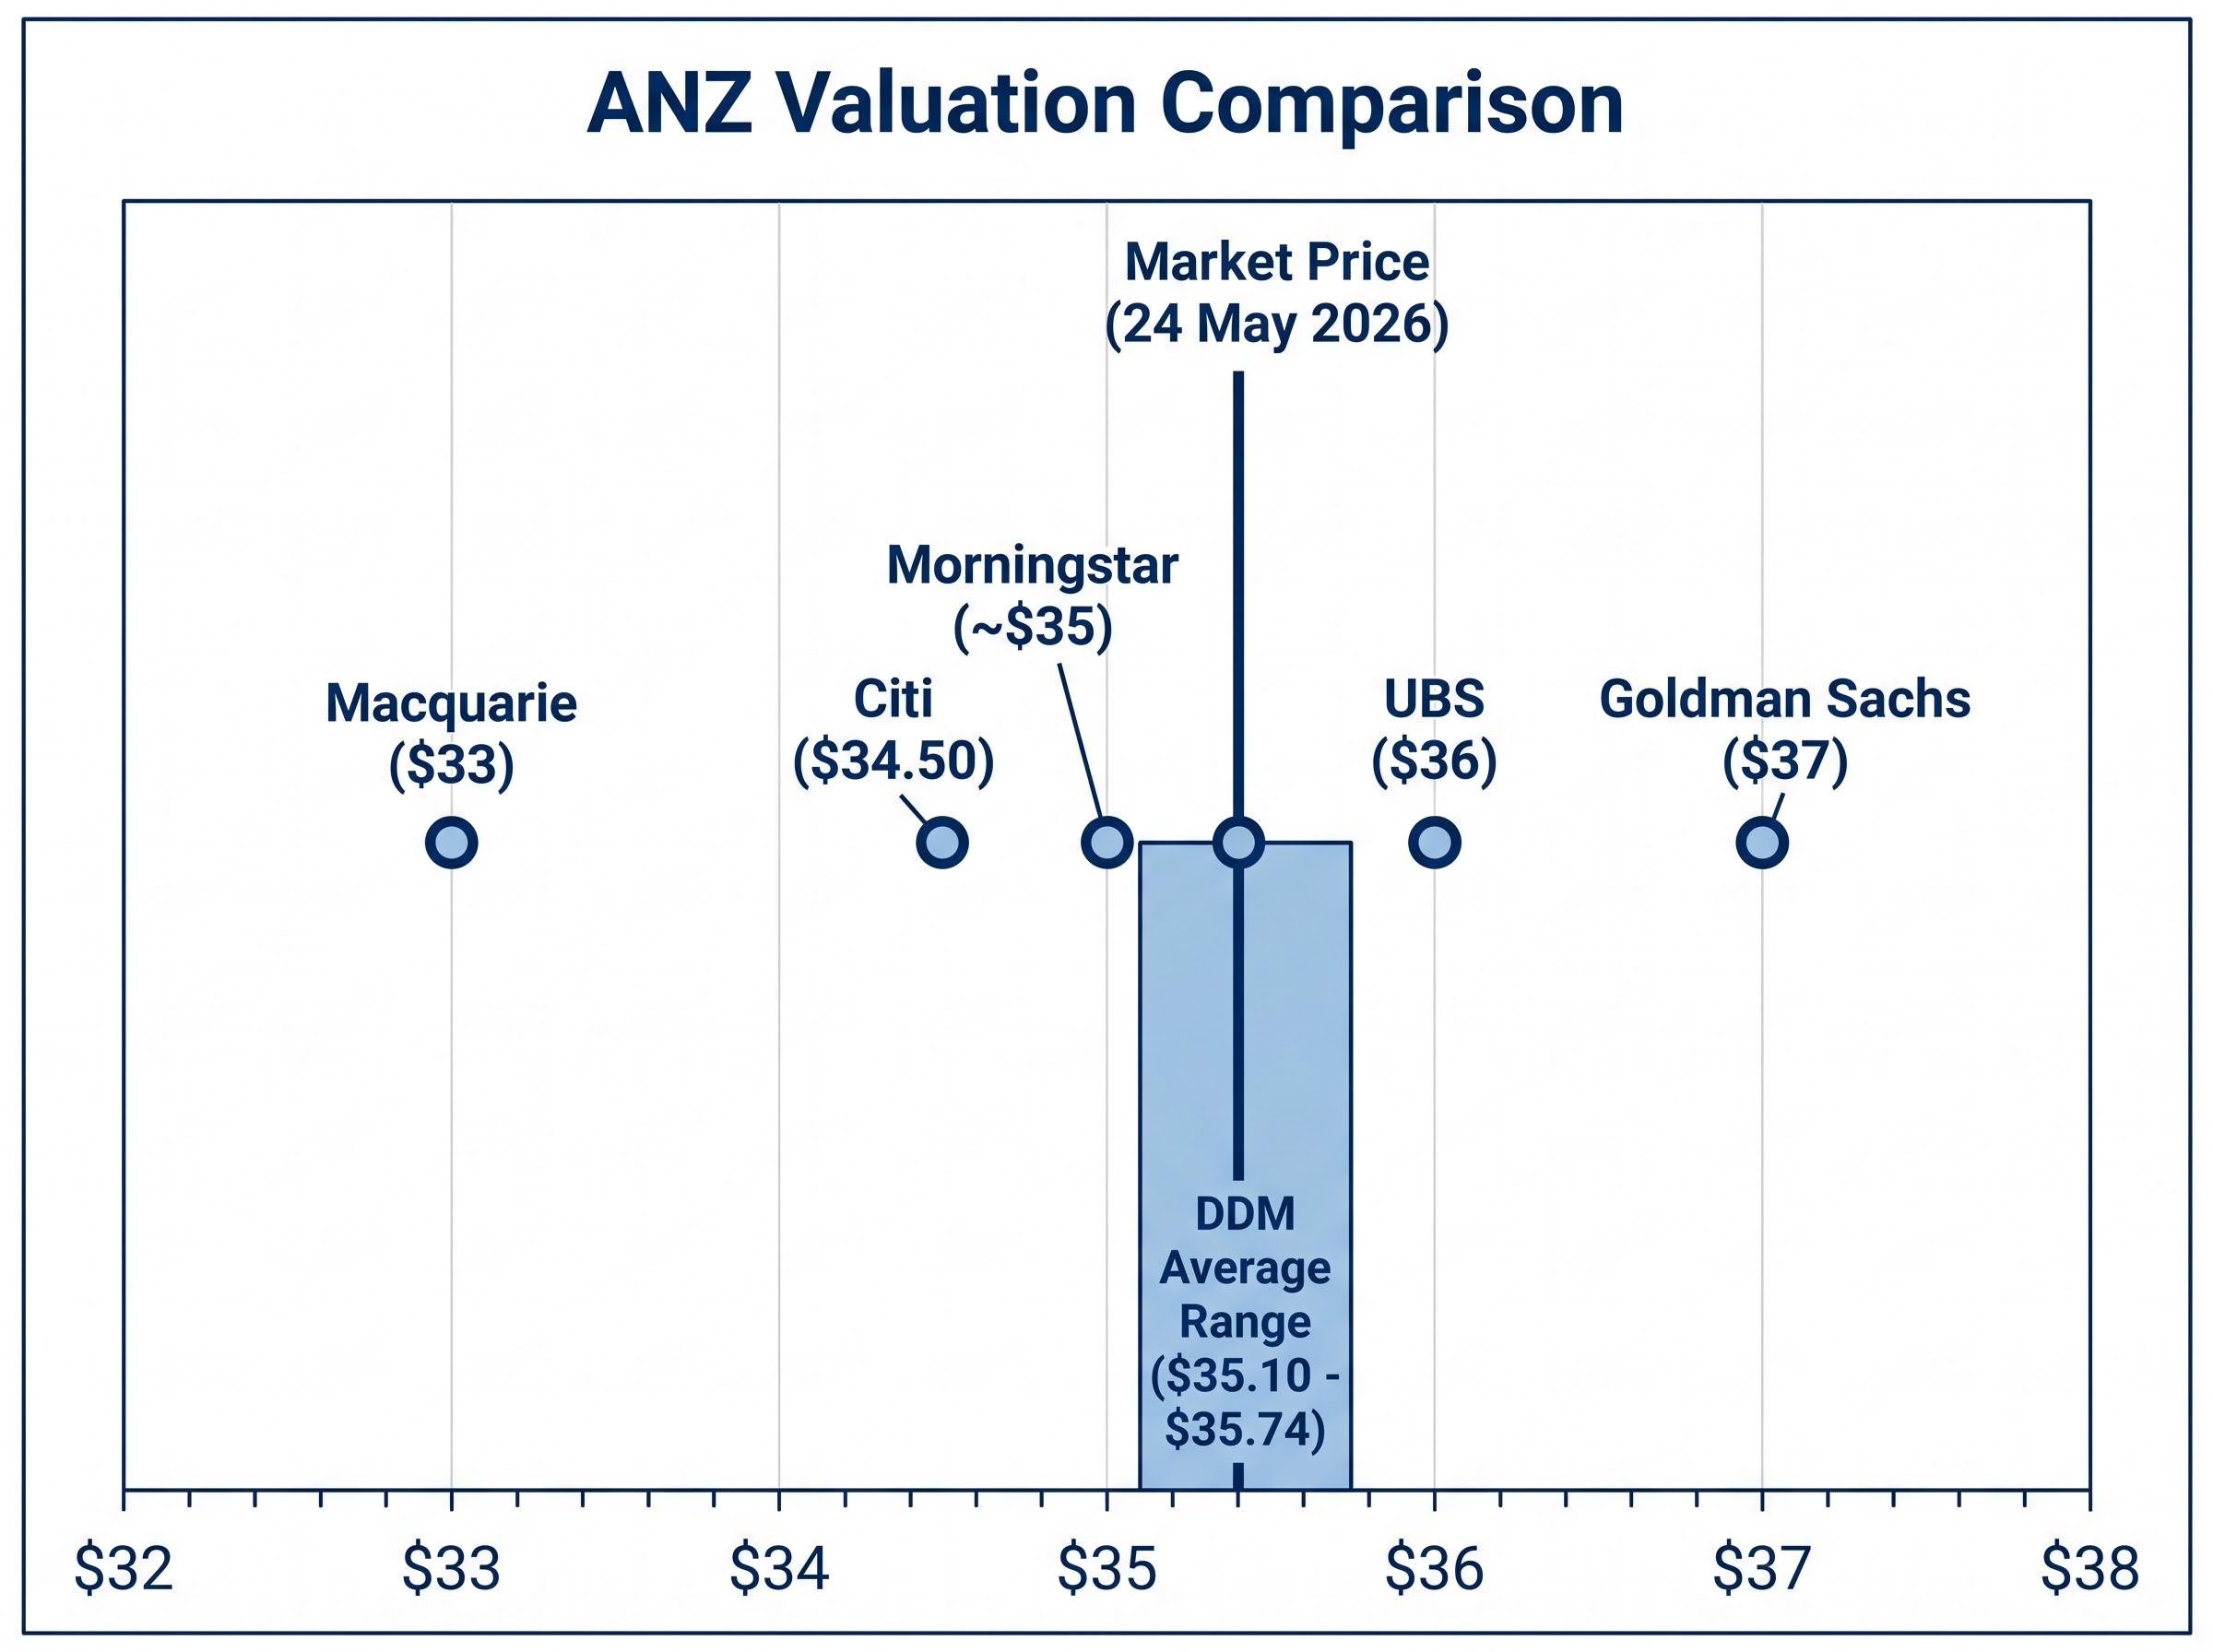
Using an adjusted forward dividend of $1.69 per share (based on the FY26 consensus estimate of approximately 168 cents), the DDM average fair value shifts to approximately $35.74, just 24 cents above the market price of $35.50 on 24 May 2026.
“ANZ’s market price of $35.50 on 24 May 2026 sits within 24 cents of the DDM adjusted average estimate of $35.74, placing the stock squarely in ‘fairly valued’ territory under mid-case assumptions.”
Broker and research targets provide external validation:
The scenario matrix is not a problem to solve for a single answer. It is a map of assumptions. The reader’s job is to decide which assumptions they believe, then locate themselves on that map.
A DDM built on cash dividends alone understates what Australian resident investors actually receive from a stock like ANZ. Franking credits represent corporate tax already paid on the earnings that fund the dividend, and eligible investors can use them to offset personal income tax or receive them as a cash refund.
Franking credit fundamentals matter before the grossing-up arithmetic, because the eligibility rules, holding period requirements, and SMSF pension-phase treatment all affect whether a given investor can actually capture the credit value that the DDM adjustment assumes.
The franking profile at ANZ has shifted in recent years, a direct consequence of the bank’s changed tax position following the Suncorp Bank acquisition:
That decline from full franking to partial franking is material for DDM inputs. It affects both the grossed-up yield and any relative value comparison against fully franked alternatives.
Two valid approaches exist for incorporating franking credits into the model. The first, and simpler, method is to model cash dividends only in the DDM and treat the franking credit as a separate after-tax return adjustment layered on outside the model. The second approach grosses up the dividend for the franking credit and uses an after-tax discount rate consistent with the investor’s own tax position. For most retail investors, approach one is less error-prone.
For those who want to gross up directly, the arithmetic on the H1 FY26 interim dividend illustrates the method:
The difference between 83 cents in cash and approximately $1.07 grossed up is meaningful when compounded across a full year’s dividends.
The grossed-up dividend yield, rather than the face cash yield, is the correct input for investors in low or zero tax environments, because using the cash figure alone understates the effective return and systematically undervalues fully or partially franked dividend payers relative to unfranked alternatives.
“For eligible Australian investors, the franking credit component effectively increases the after-tax value of ANZ’s dividend beyond what the cash figure alone suggests.”
This article is for informational purposes only and should not be considered financial advice. Investors should conduct their own research and consult with financial professionals before making investment decisions.
Confidence in the DDM should carry a productive asterisk. The model extrapolates past dividend policy into the future, but three forces specific to Australian banks can force abrupt changes to payout ratios that no growth-rate assumption anticipates.
APRA capital requirements can tighten without warning, absorbing earnings that would otherwise fund dividends. NIM cycles can compress margins beyond what the current trajectory implies. And credit loss provisions, dormant during benign economic periods, can spike in a downturn and force dividend cuts.
ANZ’s NIM of 1.57% already sits below the major-bank average of 1.78%, according to Rask Invest Research Team calculations. If mortgage competition or rising deposit costs push NIM below 1.5%, the earnings base supporting the assumed dividend trajectory weakens materially.
The DDM tends to overstate fair value for banks when historical dividend growth rates are applied without accounting for structural changes in ROE, regulatory capital demands, or economic cycle positioning. ANZ’s FY24 ROE of 9.3%, which sat below the sector average of 9.35%, illustrates how a period of subdued returns can lag dividend growth, creating a gap the model cannot self-correct.
Four specific conditions would erode the DDM base case for ANZ:
CFA Society Sydney guidance recommends that scenario analysis on credit losses and capital requirements should complement DDM for mature dividend payers.
ASX bank valuation methods that incorporate qualitative factors, including management track record, loan book composition, and APRA compliance history, consistently identify risks that quantitative models like the DDM cannot price, particularly during the early stages of a credit cycle deterioration when provisions are still being set conservatively.
Professional analysts rarely rely on DDM alone for bank valuations. The price-to-book versus ROE versus cost-of-equity framework offers a useful cross-check: a bank trading at a price-to-book premium relative to its ROE-minus-cost-of-equity spread may be overvalued even if the DDM suggests fair value.
Morningstar Australia uses a dividend discount and excess equity model combination for the big four. The broker fair value band of $33-$37 for ANZ aligns with the DDM mid-case outputs, providing external validation from analysts using complementary methods. A DDM that gives a precise dollar figure creates a false sense of certainty. Understanding which real-world developments would break the model’s assumptions turns passive recipients of a valuation into active monitors of the conditions that keep it valid.
Past performance does not guarantee future results. Financial projections are subject to market conditions and various risk factors.
Under mid-case assumptions, ANZ at $35.50 on 24 May 2026 appears fairly valued. The stock sits within the DDM average range of $35.10-$35.74 and the broker consensus band of $33 (Macquarie) to $37 (Goldman Sachs), with no obvious margin of safety at current prices.
The more lasting value of the exercise is the replicable framework it provides for any ASX bank stock:
For ANZ specifically, three forward variables warrant monitoring over the next 12 months:
The DDM does not tell investors whether to buy or sell ANZ. It tells them what conditions would need to be true for the current price to represent good value, and what would need to change for the stock to re-rate materially higher or lower. That disciplined framing, applied consistently and stress-tested honestly, is the actual skill this guide aims to build.
These statements are speculative and subject to change based on market developments and company performance.
The dividend discount model (DDM) values a share as the present value of all future dividends discounted at a required rate of return. It suits ANZ because the bank pays large, relatively predictable dividends, with interest income representing 78% of total revenue in the most recent full financial year.
Running a DDM across a full matrix of growth and discount rate scenarios produces an average fair value of approximately $35.10 per share, while using the FY26 consensus forward dividend shifts that estimate to $35.74, placing ANZ's market price of $35.50 on 24 May 2026 squarely in fairly valued territory under mid-case assumptions.
Franking credits represent corporate tax already paid on earnings, and eligible Australian investors can use them to offset personal tax or receive them as a cash refund. ANZ's franking level dropped from fully franked in FY24 to 70% in FY25 and 75% in H1 FY26, which affects the grossed-up dividend and alters the effective return captured in the model.
Given ANZ's net interest margin of 1.57% (below the major-bank average of 1.78%) and a 10-year Australian government bond yield near 4.92%, the most analytically defensible inputs are a required return in the 8%-9% range paired with a dividend growth rate of 2%-3%, which produce fair value estimates clustering around $28-$34 per share.
The DDM extrapolates past dividend policy into the future and cannot anticipate abrupt changes driven by APRA capital requirement increases, net interest margin compression, or credit cycle deteriorations that force dividend cuts. Professional analysts typically complement the DDM with price-to-book versus return-on-equity frameworks and excess equity models to cross-check outputs.