Why Franking Credits Change Every NAB Dividend Discount Model
9 hrs ago

A sensitivity table for Westpac’s dividend discount model produces valuations ranging from $17.89 to $80.50 per share, depending on the assumptions fed in. That range is not a model malfunction. It is the point. With the Reserve Bank of Australia (RBA) cash rate raised to 4.35% at its 6 May 2026 meeting, interest rate volatility sits at the centre of every conversation about Australian bank share valuation. Retail investors often reach for price-to-earnings (PE) ratios and dividend discount models (DDM) as quick anchors. Professional analysts, by contrast, routinely invest upwards of 100 hours in qualitative investigation before they open a single spreadsheet. The gap between those two approaches determines whether a valuation tells you something useful or something dangerously precise. What follows is an examination of why mechanical models are insufficient for pricing CBA, WBC, ANZ, and NAB, and which qualitative and macroeconomic factors must sit alongside any model to form a sound investment view.
The numbers look precise. Westpac trades at approximately $36.55, with FY24 earnings per share (EPS) of $1.92, placing the stock on a PE of roughly 19x. The ASX banking sector average sits near 18x. Apply the sector multiple to Westpac’s earnings and the output is approximately $34.96, a figure that carries decimal-point specificity while resting entirely on which earnings figure and which peer multiple the investor selects.
PE ratios compress or expand with macro risk, not just earnings. In a high-rate, high-inflation environment, the long-run average PE for Australian banks becomes a less reliable reference point. A stock trading below its historical multiple may not be cheap if earnings reflect peak-cycle margins and impairments are rising.
The dividend discount model treats a share’s value as the present value of all future dividend payments, a deceptively simple framing that collapses when the underlying inputs, particularly growth and discount rates, are drawn from macro assumptions rather than company-specific fundamentals.
The DDM introduces a different layer of false precision. Three inputs drive the output:
Each of these inputs is macro-dependent, not company-specific. Using a $1.66 annual dividend, DDM scenarios produce an average output near $35.10. Switch to the gross dividend (including franking credits) of approximately $2.30, and the average jumps to roughly $48.64. Adjust the discount rate from 11% to 6% or the growth rate from 2% to 4%, and the model’s range spans from $17.89 to $80.50 for the same stock.
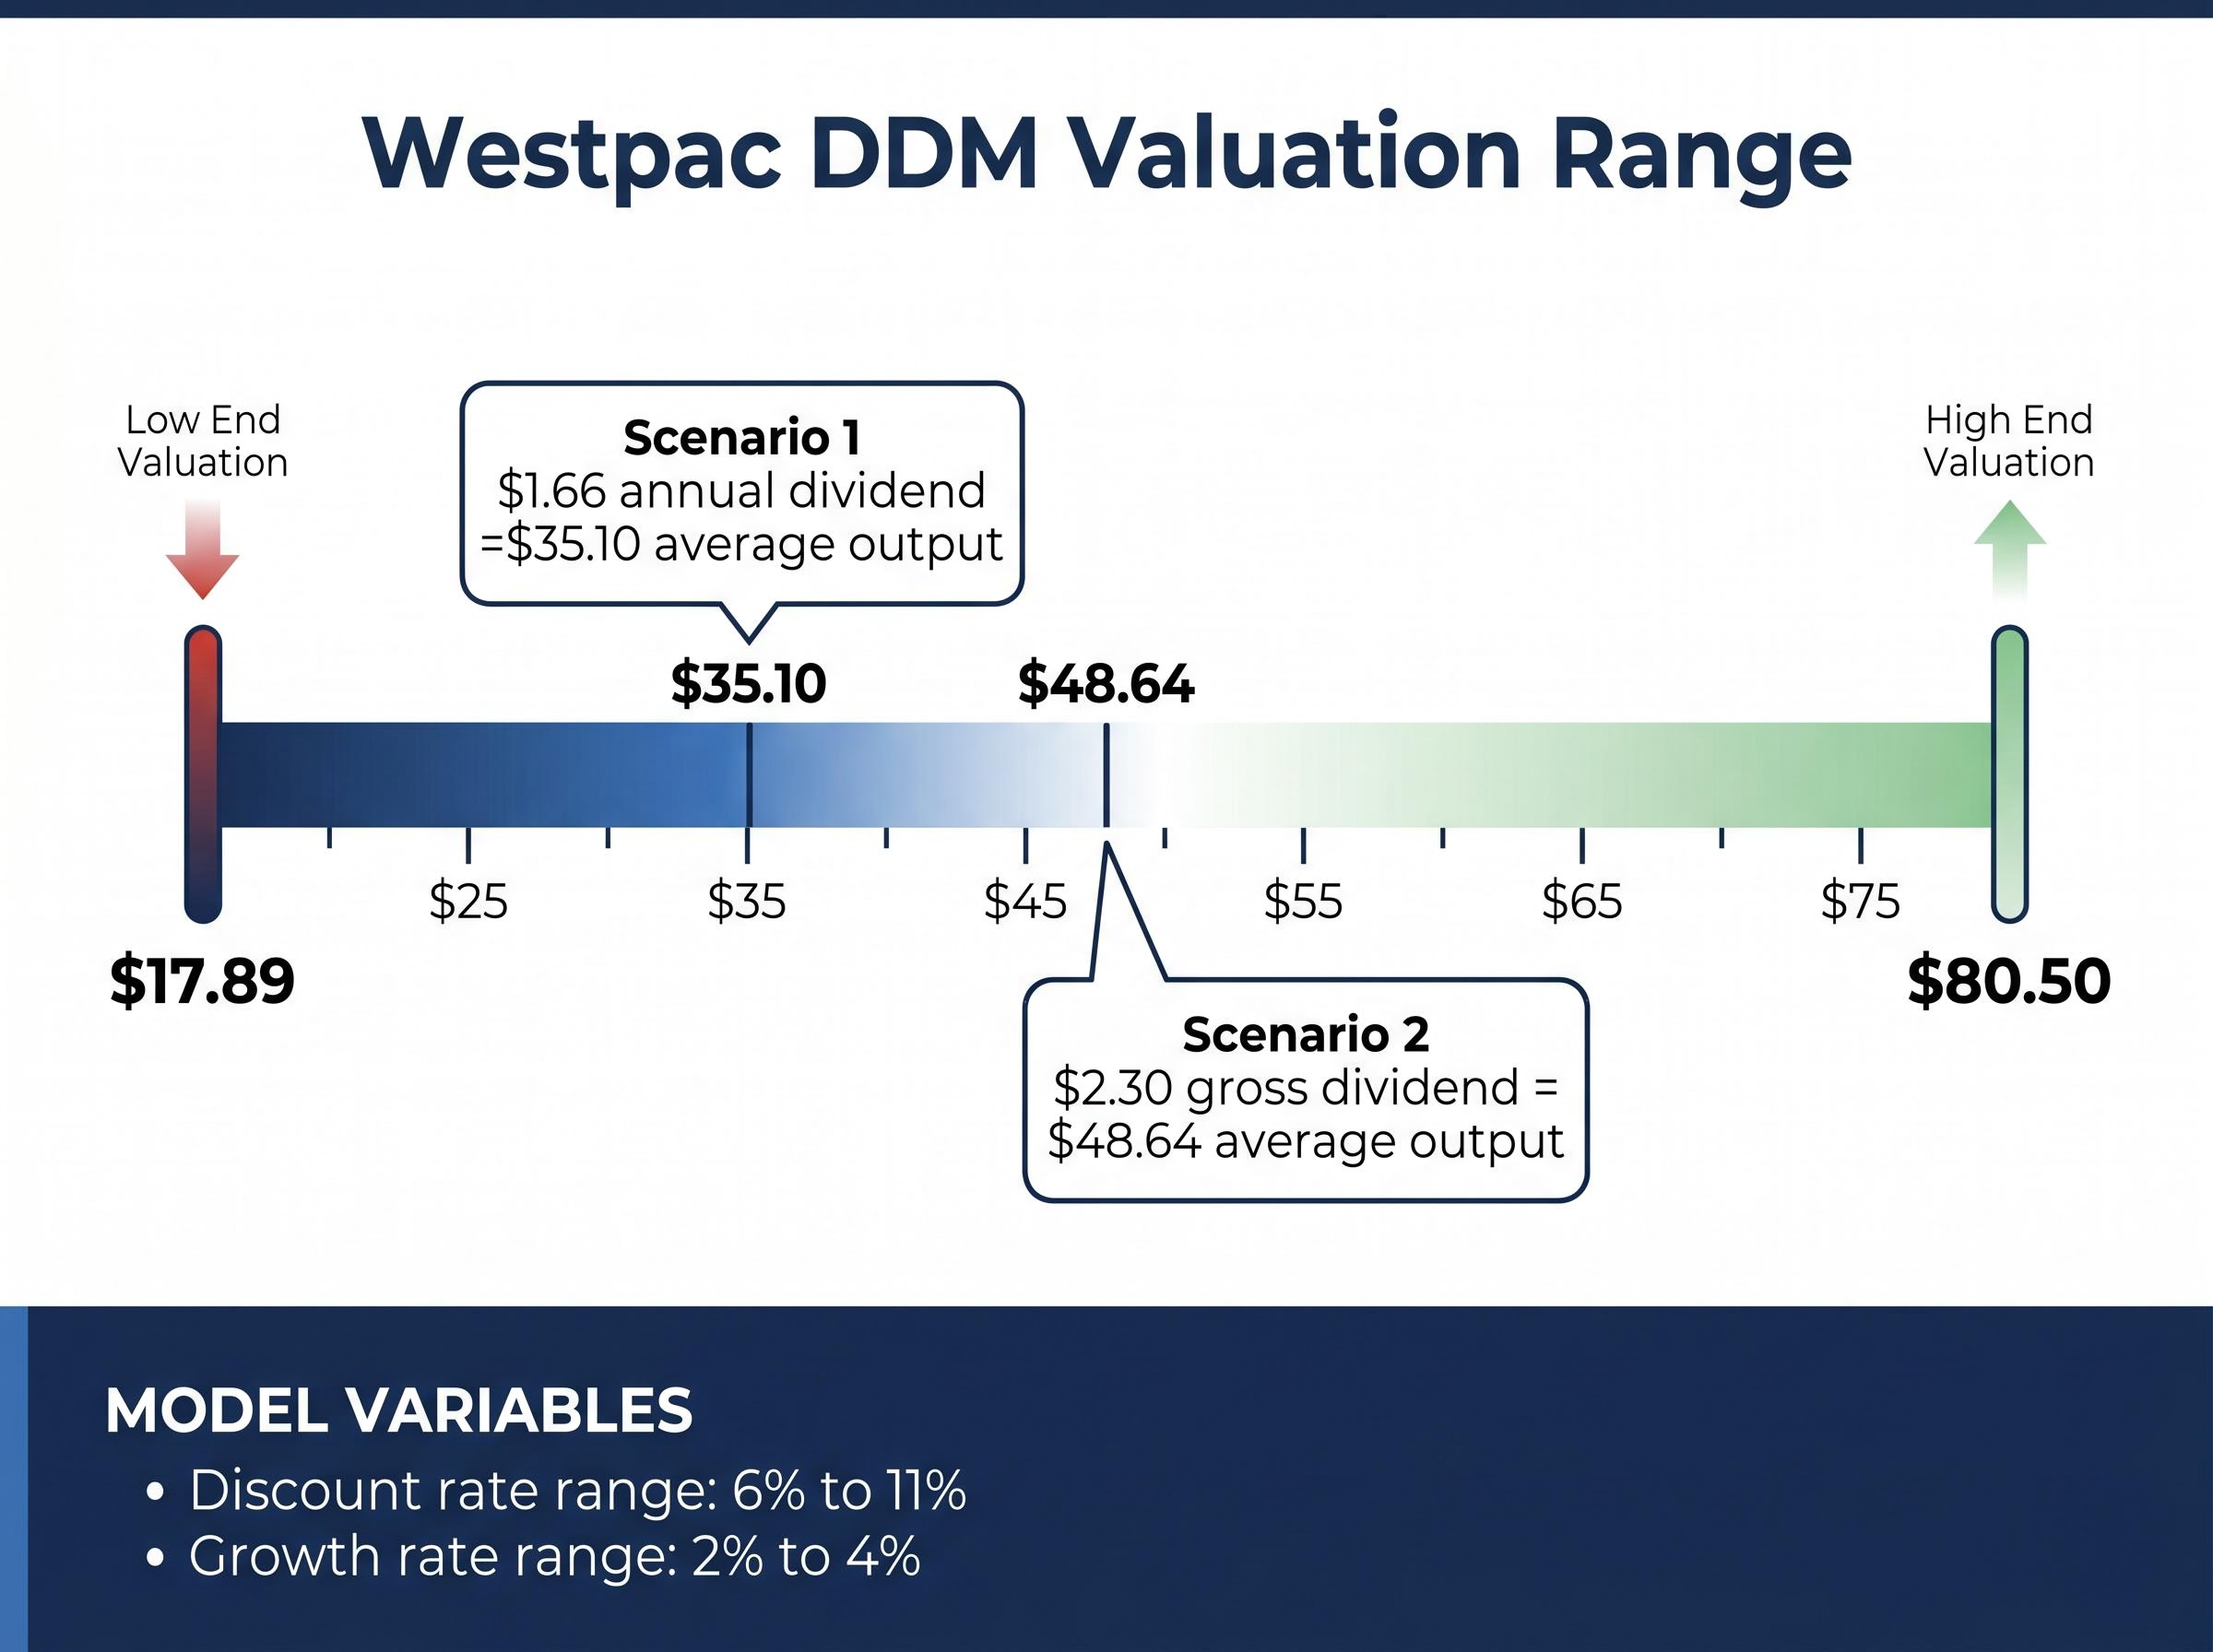
“$17.89 to $80.50 per share for the same stock, same model, different assumptions.”
Morningstar analysts caution that mechanical DDM models can overvalue banks when they extrapolate elevated payout ratios or temporarily high net interest margins (NIMs). The spread is not a reason to abandon the model. It is a reason to interrogate which assumptions are defensible, and that interrogation is qualitative.
A common intuition holds that higher interest rates benefit banks. The logic is straightforward: banks earn more on loans when rates rise. For a specific window early in a hiking cycle, that intuition holds. NIMs widen as lending rates reprice faster than deposit costs.
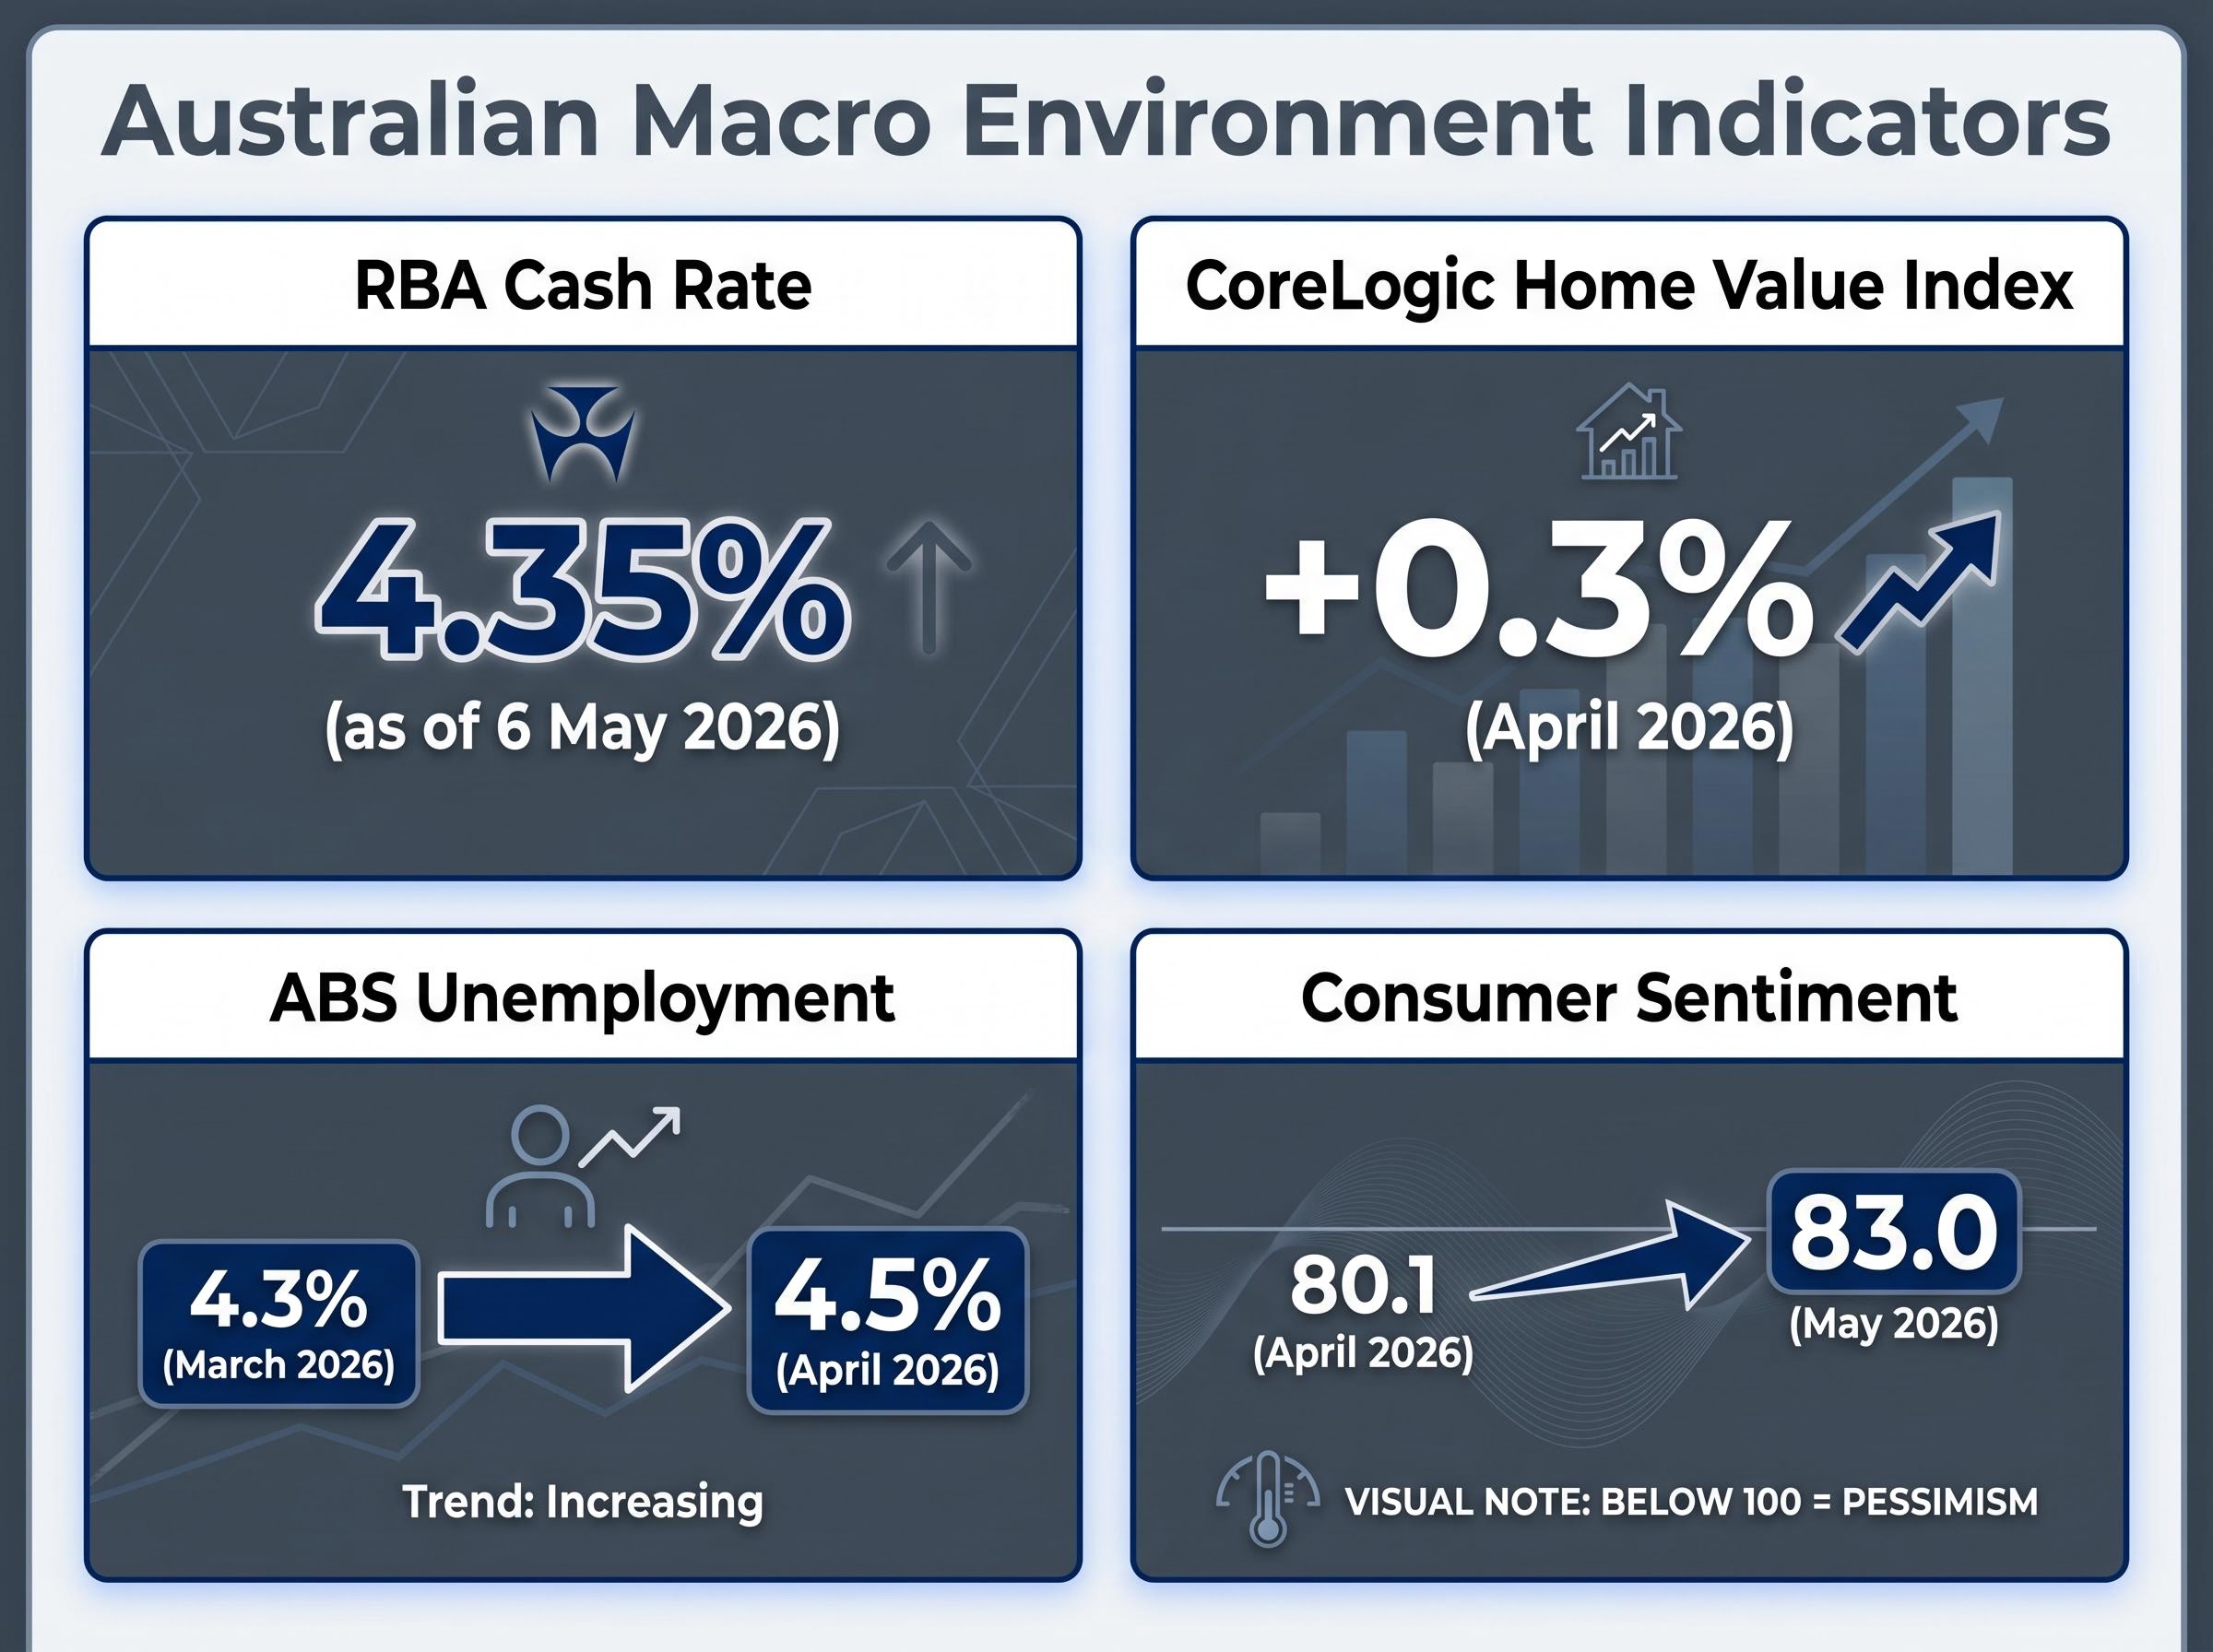
That window has closed. The RBA’s 25 basis point increase to 4.35% at its 6 May 2026 meeting marks a phase where elevated rates now function as a credit-quality risk rather than an earnings tailwind.
The RBA cash rate decision on 6 May 2026 was the third consecutive tightening move from a starting point of 3.85% in January 2026, a pace of hiking that compressed bank net interest margins before the revenue benefit of higher rates could flow through to reported earnings.
Morgan Stanley described the sector as entering a “late-cycle margin squeeze,” characterised by compressing margins and rising credit stress.
Three structural headwinds define the current NIM environment:
Macquarie Equities forecasts low-single-digit EPS growth for the majors in FY26. UBS, Morgan Stanley, and Jarden place NIMs for CBA, WBC, ANZ, and NAB at flat or slightly below FY24 levels. An investor pricing bank shares using last year’s NIM assumptions is likely embedding an earnings trajectory the market has already repriced.
Property prices, labour market conditions, and consumer sentiment do not operate in isolation. Read together, they define the environment in which bank earnings are generated.
Rising house prices support credit quality. The CoreLogic Home Value Index for April 2026 showed national dwelling values up 0.3% for the month, the slowest growth in nearly a year. Growth was strongest in Perth, Brisbane, and Adelaide, while Sydney and Melbourne were subdued or negative. For banks with mortgage-heavy books, rising collateral values reduce negative-equity risk. Yet affordability constraints are simultaneously limiting new loan volume growth, capping one side of the earnings equation.
Unemployment tells the credit-normalisation story. The ABS Labour Force survey recorded 4.3% in March 2026, edging to 4.5% in April 2026. This is not crisis territory, but it signals the economy has moved past peak tightness. Analysts expect impairment charges to rise from ultra-low levels rather than spike, with credit charges in FY25-26 expected to exceed FY22-23 levels while remaining below long-run averages absent a sharp unemployment rise.
Household debt levels sitting at approximately 186% of disposable income place Australian borrowers among the most leveraged in the developed world, a structural condition that amplifies the sensitivity of bank earnings to unemployment and rate cycles beyond what any single-period PE ratio can capture.
| Factor | Current Reading | Direction | Implication for Banks |
|---|---|---|---|
| Property Prices | +0.3% nationally (April 2026) | Rising, but decelerating | Supports collateral values; affordability constrains new lending volumes |
| Unemployment | 4.5% (April 2026) | Edging higher from cycle lows | Benign near-term; medium-term credit risk rising |
| Consumer Sentiment | 83.0 (May 2026) | Up from 80.1 in April, still deeply pessimistic | Mutes discretionary credit demand and large-ticket borrowing |
The Westpac-Melbourne Institute Consumer Sentiment Index measures whether respondents feel optimistic or pessimistic about economic conditions. A reading below 100 means more pessimists than optimists. At 83.0 in May 2026, the index remains firmly in pessimistic territory despite a marginal improvement from 80.1 in April.
Westpac economics commentary links persistently weak sentiment to suppressed large-ticket borrowing and subdued demand for discretionary credit. For bank earnings, this compounds the volume constraint already visible in mortgage markets: borrowers are prioritising repayments over new spending, supporting near-term credit quality but capping loan growth.
Fund managers at firms such as Plato, Perpetual, and Magellan describe headline PE and dividend yield as entry points only. The substantive analytical layer sits beneath the numbers, and it requires discipline, not just data.
Professional analysts invest upwards of 100 hours in qualitative investigation before building financial models for a single bank stock.
That time is spent working through a structured sequence:
The RBA-APRA Memorandum of Understanding update is particularly relevant. Enhanced coordination on financial stability implies that macroprudential responses, such as changes to lending standards, may be more closely aligned with the RBA’s macro views. For analysts, this introduces a qualitative variable that no PE ratio or DDM formula can automatically capture.
Professional analysts do not treat these factors as commentary layered on top of the numbers. They treat them as the framework within which numbers become meaningful.
APRA’s “unquestionably strong” capital requirements create a floor on how much capital banks can return to shareholders. This directly constrains sustainable payout ratios, and therefore constrains the dividend input in any DDM calculation. Regulatory factors distort standard valuation inputs in several ways:
APRA’s unquestionably strong capital framework sets the benchmarks that constrain how much capital the major banks can distribute to shareholders, meaning payout ratios embedded in DDM calculations are not freely adjustable inputs but regulated outcomes that shift when APRA’s supervisory priorities shift.
All four majors describe a shift from a “benign” to a “normalising” credit environment. The distinction matters. During the pandemic, banks built broad, precautionary loan loss overlays against scenarios that largely did not materialise. Those overlays are now being replaced by targeted provisions for specific stress pockets: cost-of-living pressure among lower-income borrowers, interest-only loan rollovers, and stretched small-to-medium enterprise (SME) customers.
APRA quarterly data for 2025-2026 shows impaired assets and past-due loans remain low by historical standards but have risen from post-COVID lows. S&P Global Ratings and Moody’s arrears indices report gradual increases, particularly among non-bank lenders and lower-income borrowers, though major-bank arrears remain relatively contained.
Credit charges are expected to be higher in FY25-26 than in FY22-23, even if they remain below long-run averages. UBS, Morgan Stanley, and Macquarie explicitly advise combining PE and DDM with top-down macro views and bottom-up asset-quality assessment. A low PE is not necessarily cheap if earnings reflect peak-cycle margins; a high DDM value can mislead if capital requirements force lower payout ratios.
The $17.89-to-$80.50 DDM range for Westpac is not a reason to distrust modelling. It is a reason to be deliberate about which end of the range an investor’s macro, credit, and regulatory views justify.
A practical sequence for retail investors approaching Australian bank valuations:
“Macro assumptions about rates, unemployment, and property prices are more important to bank valuation than the precise PE at any given moment.” Broker consensus, as reported in the Australian Financial Review, 2025-2026.
This is how professional analysts approach the sector. Adopting a version of the same framework, however simplified, positions a retail investor to evaluate whether a bank stock’s apparent cheapness or expensiveness reflects reality or assumption. The spreadsheet is the last step, not the first.
Investors ready to extend beyond PE and DDM will find our comprehensive walkthrough of balance sheet valuation metrics, which covers NPL ratios, CET1 capital buffers, deposit funding composition, and price-to-book multiples across CBA, ANZ, NAB, Westpac, and Macquarie, including why a payout ratio above 75-80% warrants scrutiny when credit charges are rising.
This article is for informational purposes only and should not be considered financial advice. Investors should conduct their own research and consult with financial professionals before making investment decisions. Past performance does not guarantee future results. Financial projections are subject to market conditions and various risk factors.
A dividend discount model values a share as the present value of all future dividend payments, using inputs such as dividend per share, a growth rate, and a discount rate. For Australian banks, this model is highly sensitive to macro assumptions, producing a valuation range as wide as $17.89 to $80.50 for the same stock depending on which inputs are used.
Higher RBA cash rates initially widen bank net interest margins, but once rates stay elevated for an extended period they become a credit-quality risk rather than an earnings tailwind. With the cash rate at 4.35% following the May 2026 decision, analysts describe the sector as entering a late-cycle margin squeeze with compressing margins and rising credit stress.
PE ratios compress or expand with macro risk and are especially misleading when bank earnings reflect peak-cycle margins that are unlikely to be sustained. A stock trading below its historical multiple may not be cheap if impairments are rising and net interest margins are under pressure from higher funding costs and slowing loan growth.
Professional analysts typically spend over 100 hours examining loan book composition, management quality and technology execution, APRA capital requirements, conduct history from the Hayne Royal Commission, and a macro overlay covering rates, housing, unemployment, and consumer sentiment before constructing any financial model.
APRA's unquestionably strong capital framework limits how much capital banks can distribute to shareholders, meaning payout ratios embedded in dividend discount model calculations are regulated outcomes rather than freely adjustable inputs. This constrains dividend growth even when earnings improve, making optimistic DDM scenarios potentially misleading.