Why Franking Credits Change Every NAB Dividend Discount Model
9 hrs ago

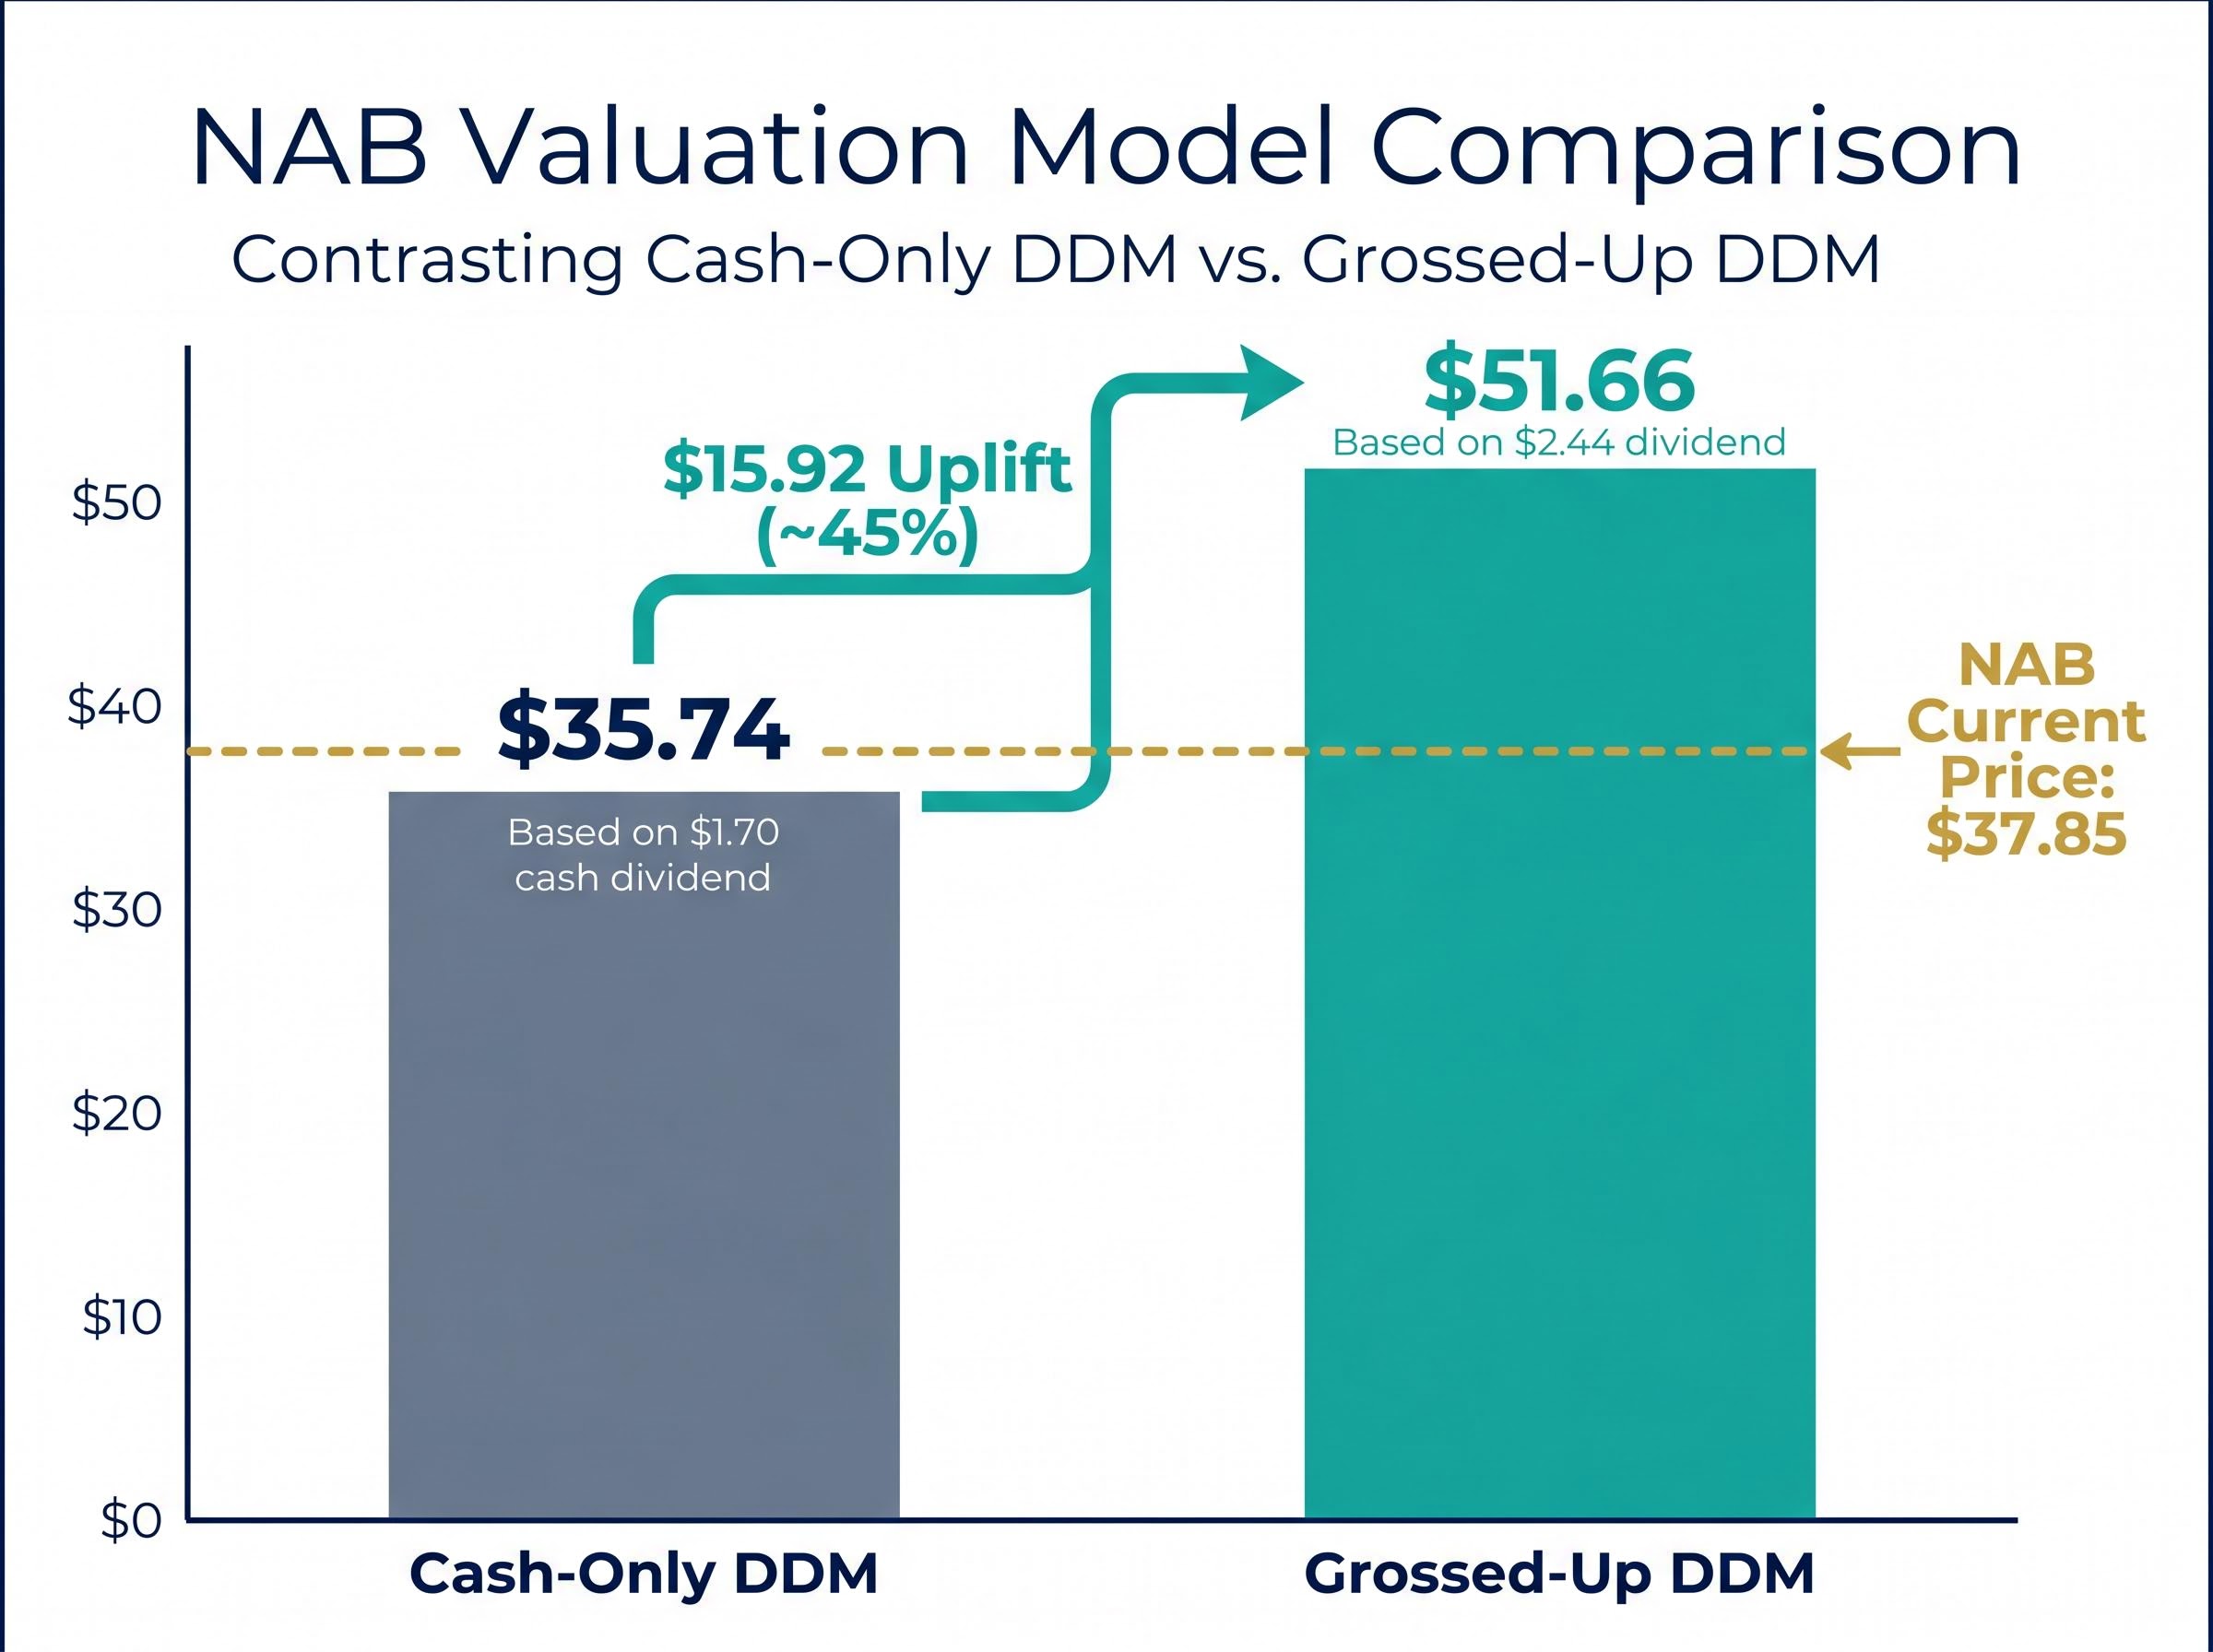
A fully franked National Australia Bank dividend of $1.70 per share looks like a $1.70 return. Run it through a Dividend Discount Model with franking credits included and it becomes a $2.44 input, pushing the estimated share value from roughly $35.74 to $51.66. Same stock, same dividend, very different number. The Dividend Discount Model is one of the oldest valuation frameworks used by professional analysts, and Australian bank stocks are among the most natural candidates for it: they pay large, regular, fully franked dividends and have done so for decades. Yet most retail applications of the model stop at the cash dividend and ignore the tax credit attached to it, which for many Australian investors represents real, refundable money. This article explains how the DDM works, walks through a concrete NAB example using current dividend data, and shows precisely why incorporating franking credits changes the estimated value so dramatically.
The DDM values a company by treating it as a machine that produces future dividend payments, then asks a single question: what are all those future payments worth in today’s dollars? The logic rests on one straightforward idea. A dollar received a year from now is worth less than a dollar received today, because today’s dollar can be invested and earn a return in the meantime. The “discount rate” captures both that time preference and the risk that the payment might not arrive at all.
The DDM formula origins trace back to John Burr Williams, who formalised the present-value approach to dividend income in 1938 as a direct reaction to the speculative excesses of the 1920s bull market, anchoring stock valuation to the cash a business actually returns to shareholders rather than to price momentum or sentiment.
What makes the model deceptively accessible is that it requires only three inputs beyond the basic formula:
The DDM formula: Share price = annual dividend ÷ (discount rate − dividend growth rate)
Retail applications commonly use a discount rate of 9-10% and a long-run dividend growth rate of 2-3% for Australian major banks. The formula’s simplicity is also its primary risk: small changes in either assumption produce large swings in the output, a sensitivity that becomes visible once the numbers are run.
The Dividend Discount Model works best when a company pays consistent, predictable dividends that represent a genuine return of earnings rather than an occasional or discretionary payout. Not every listed company fits this profile. A high-growth technology firm that reinvests all its earnings has no dividend stream to discount. A mining company with volatile commodity-linked earnings may cut its dividend sharply in a downturn.
The structural characteristics that make a company suitable for DDM valuation include:
Australian major banks tick every box. They operate under regulated capital requirements that constrain how much profit can be reinvested for growth, and they have maintained or grown dividends through most economic environments over decades. Collectively, Australian major bank stocks account for more than one-third of the S&P/ASX 200 by market capitalisation, meaning bank dividend valuations carry index-level relevance for Australian investors.
The ASX sectors suited to DDM valuation extend well beyond banks: utilities, REITs, and infrastructure companies share the same structural characteristics of regulated returns and mandated distribution requirements that make dividend streams predictable enough to discount with confidence.
NAB’s most recent dividend was 85 cents per share, fully franked, declared as the 2026 interim dividend for the six months ended 31 March 2026 and payable 2 July 2026. In FY25, the bank paid a full-year dividend of $1.70 per share (two payments of 85 cents, both fully franked). The prior year’s total was $1.69 per share (85 cents interim plus 84 cents final in FY24).
NAB’s FY26 full-year results and final dividend announcement are scheduled for 5 November 2026. The stability of these payments, hovering around the $1.70 mark, is precisely the kind of predictable run rate that gives a DDM a credible foundation.
Applying the formula to NAB using the FY25 full-year dividend of $1.70 per share, a range of discount rates between 6% and 11%, and dividend growth rates between 2% and 4% produces the following scenario matrix:
| Growth Rate | 6% Discount | 8% Discount | 9% Discount | 10% Discount | 11% Discount |
|---|---|---|---|---|---|
| 2% | $42.50 | $28.33 | $24.29 | $21.25 | $18.89 |
| 3% | $56.67 | $34.00 | $28.33 | $24.29 | $21.25 |
| 4% | $85.00 | $42.50 | $34.00 | $28.33 | $24.29 |
The range is dramatic. At an 11% discount rate and 2% growth, the model estimates a value of roughly $18.89. At a 6% discount rate and 4% growth, it estimates approximately $85.00. Averaging across all combinations produces an estimated value of approximately $35.74. Adjusting the dividend input upward to a forecast figure of $1.71 produces a marginally different average valuation of $36.16.
NAB traded at $37.85 per share at the time of this analysis, against an averaged DDM estimate of approximately $35.74 using cash dividends alone.
The width of that range is the point. Investors who run a single combination of assumptions are not using the DDM; they are confirming a view they already hold. The model’s value lies in making the sensitivity visible.
When an Australian company pays 30% corporate tax on its profits and then distributes a dividend, it attaches a franking credit to that payment. The credit represents the tax already paid at the company level. Eligible shareholders include both the cash dividend and the franking credit in their assessable income, then offset the credit against their personal tax liability. If their tax liability is less than the credit (as with superannuation funds in pension phase or low-income retirees), the Australian Taxation Office refunds the difference in cash.
For NAB, the grossing-up calculation works as follows:
That grossed-up figure of $2.44 represents the pre-tax income the dividend is equivalent to. When it replaces the cash dividend as the input in the same DDM framework used in the previous section, the averaged estimated valuation rises to approximately $51.66 per share.
The grossed-up dividend yield calculation does not only affect DDM valuation; it also changes how income investors should compare bank shares against other asset classes, with an eligible investor’s effective after-tax return on NAB shares sitting materially above the headline cash yield that most broker screens and comparison tools display.
DDM estimate using cash dividends only: approximately $35.74 per share
DDM estimate using grossed-up dividends (including franking credits): approximately $51.66 per share
The difference is approximately $15.92, or roughly a 45% uplift in estimated value. For Australian investors who can fully utilise or receive a refund of franking credits, this gap is not a modelling artefact. It reflects real, tax-effective cash flow. Ignoring franking credits in a DDM for fully franked stocks is not a conservative approach; it is an incomplete one.
The $15.92 gap between the cash-only and grossed-up DDM estimates assumes the investor captures the full value of every franking credit. That assumption holds for some investors and fails entirely for others.
A franking credit’s worth depends on the recipient’s marginal tax rate. At a 0% tax rate (such as an SMSF in pension phase), the full franking credit is refunded by the ATO, meaning the effective after-tax value of every dollar of franked dividend exceeds a dollar. At the top marginal rate of 45%, franking credits reduce the tax bill rather than produce a refund, leaving an effective value of approximately 70 cents per dollar of franked dividend received. For non-resident investors, franking credits are worth zero because they cannot be used outside Australia.
The ATO guidance on franking credit refunds sets out the eligibility criteria that determine whether an investor receives the excess credit as a cash payment, confirming that superannuation funds in pension phase and qualifying low-income individuals can receive refunds where their franking credits exceed their total tax liability.
According to analysis by Livewire Markets, for low-tax or zero-tax investors, fully franked bank yields can equate to roughly 8.5-9% on a grossed-up basis against a headline cash yield of around 6%.
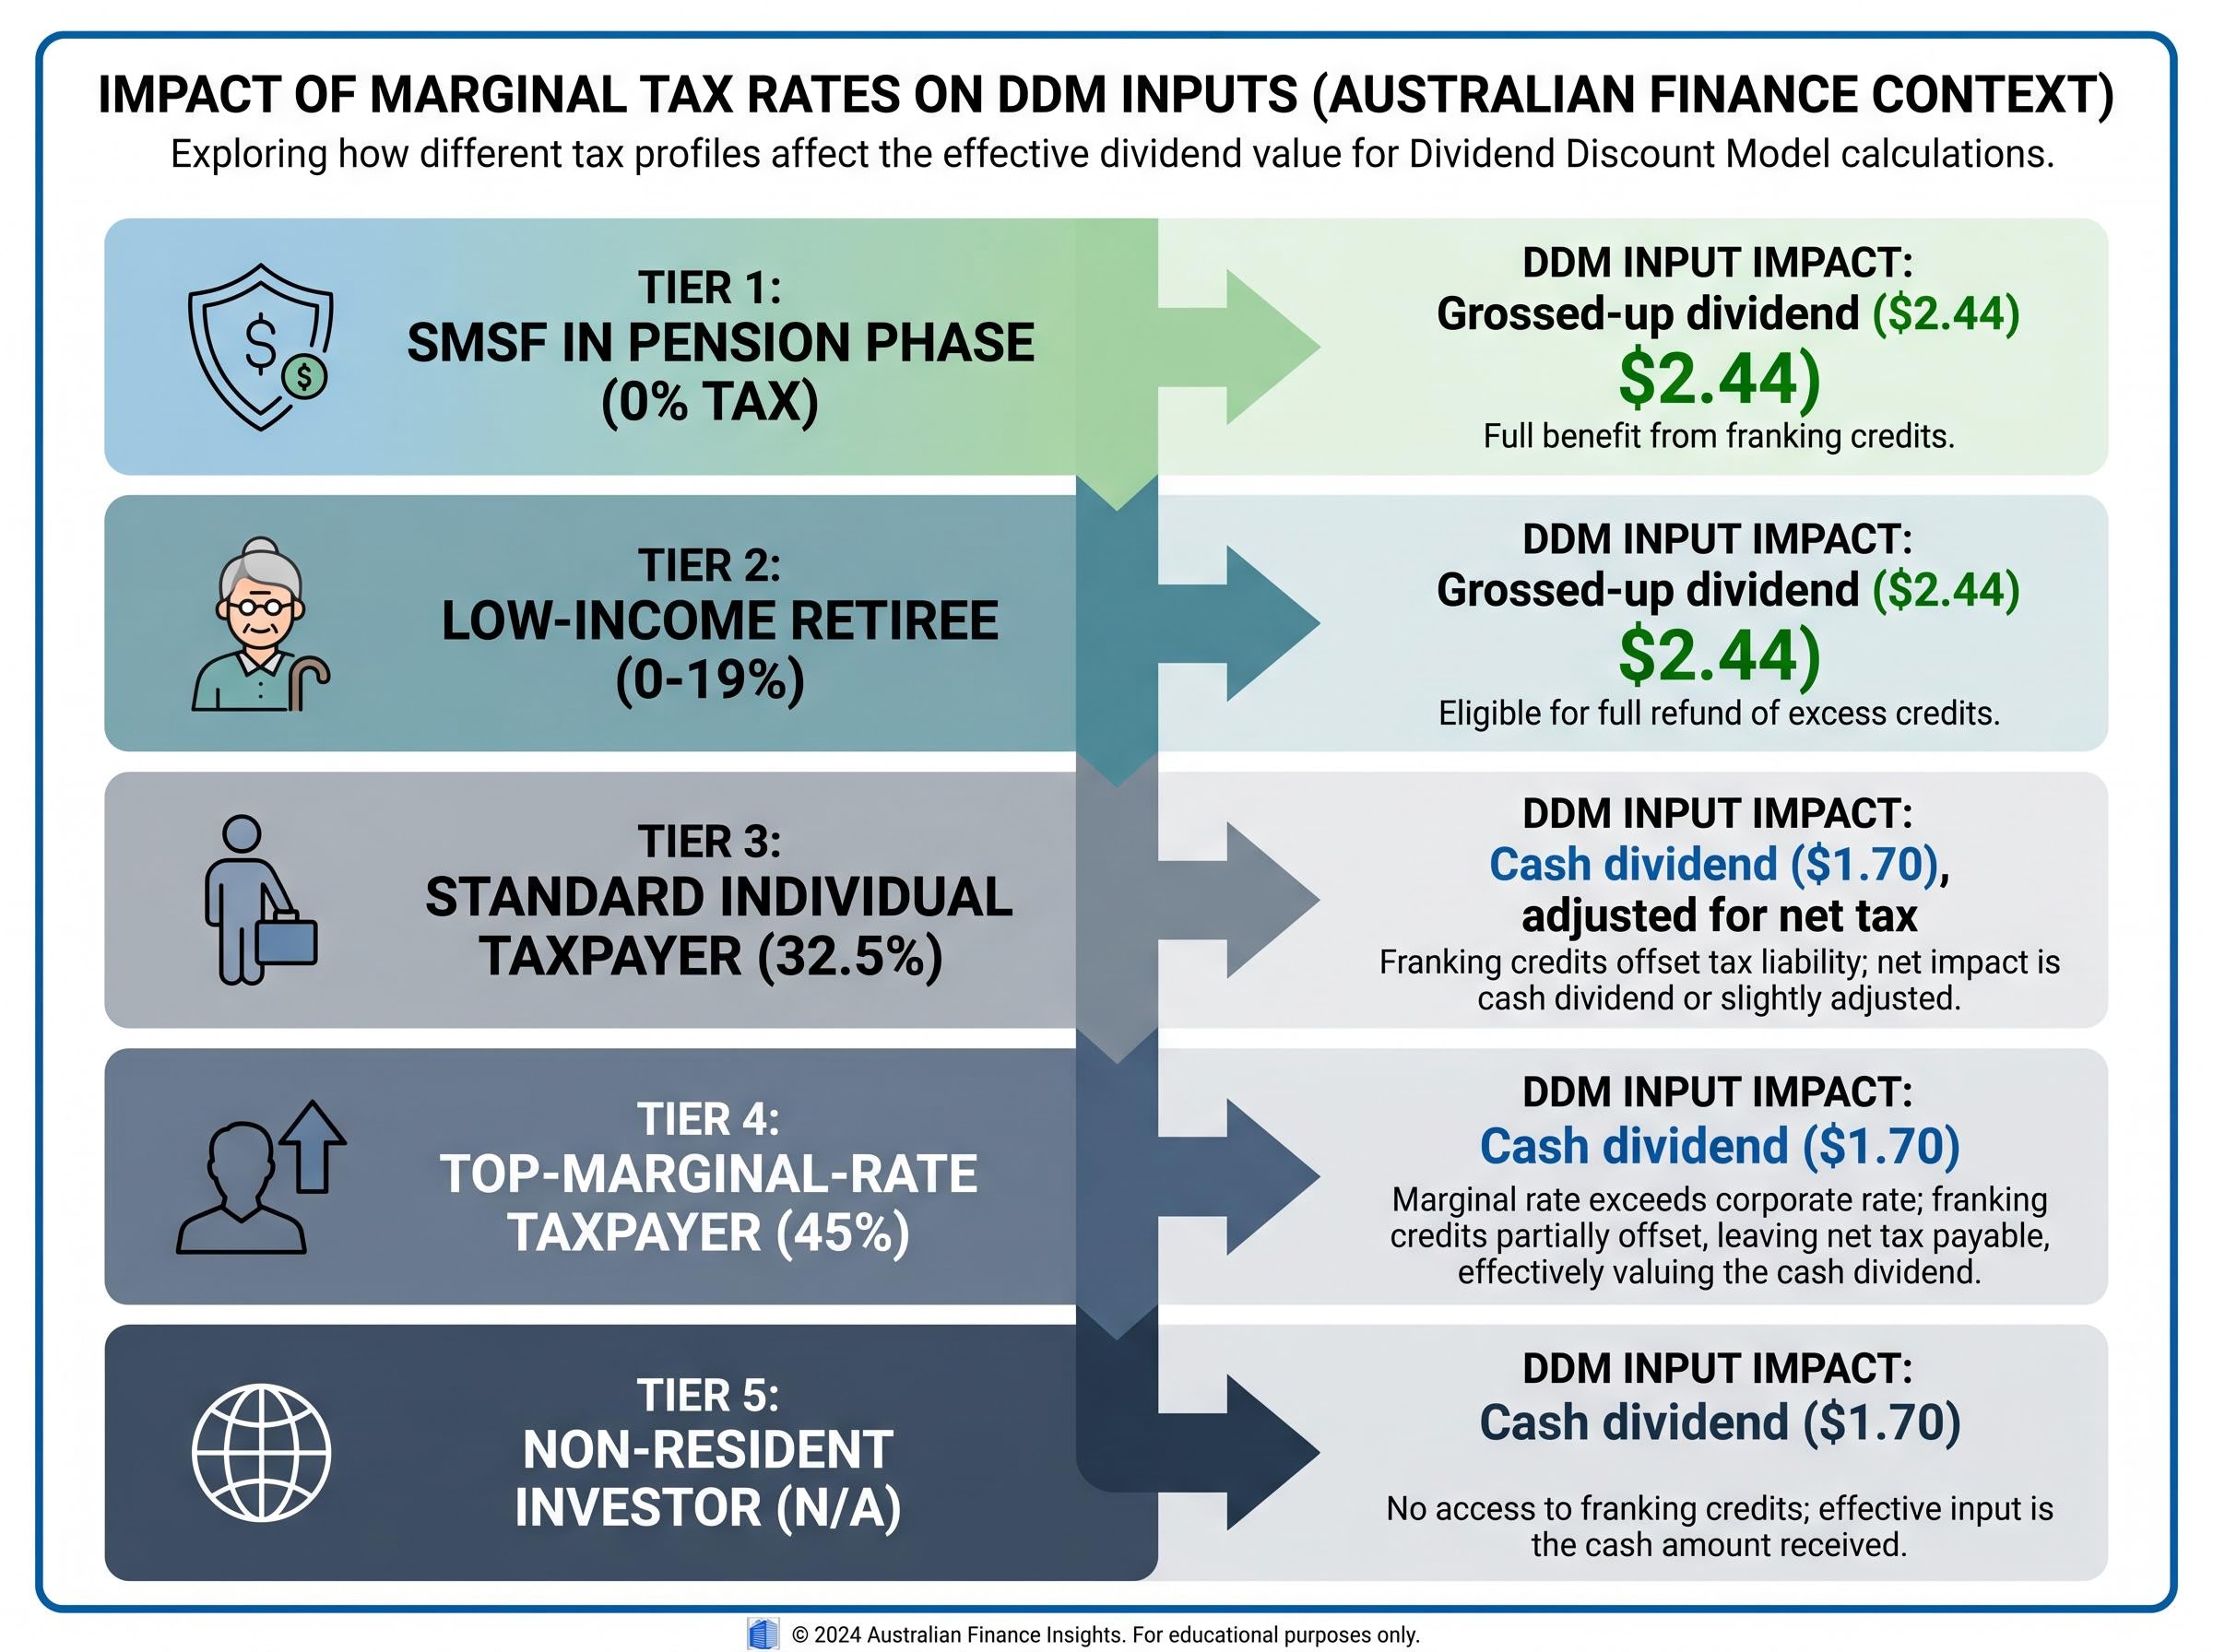
| Investor Type | Marginal Tax Rate | Franking Credit Treatment | Recommended DDM Input |
|---|---|---|---|
| SMSF in pension phase | 0% | Full cash refund from ATO | Grossed-up dividend ($2.44) |
| Low-income retiree | 0-19% | Partial or full refund | Grossed-up dividend ($2.44) |
| Standard individual taxpayer | 32.5% | Partial offset; small top-up tax payable | Cash dividend ($1.70), adjusted for net tax |
| Top-marginal-rate taxpayer | 45% | Offset only; additional tax payable on dividend | Cash dividend ($1.70) |
| Non-resident investor | N/A (foreign tax rules) | Credits cannot be used | Cash dividend ($1.70) |
Morningstar’s approach reflects this nuance. According to equity analyst Nathan Zaia, the firm’s base fair value estimates for major banks exclude the full franking benefit to maintain comparability with global peers, treating franking as an investor-specific overlay rather than baking it into the headline valuation.
Grossing up the dividend without also adjusting the discount rate double-counts the benefit. The discount rate should reflect the investor’s after-tax cost of equity, which is lower when franking credits are available and fully utilisable. A zero-tax investor receiving franked dividends faces a lower effective required return than a top-rate taxpayer receiving the same payment.
This is why some analysts, as noted by Livewire Markets contributor Shane Wendt, present two DDM valuations side by side rather than blending franking into a single number. The cash-only DDM uses a standard discount rate; the franking-adjusted DDM uses a lower discount rate calibrated to the investor’s tax position. Using the wrong pairing, a grossed-up dividend with an unadjusted discount rate, overstates value.
No single DDM output should be treated as a reliable price target. The model’s output is acutely sensitive to the growth rate and discount rate assumptions, both of which involve genuine uncertainty. Its value lies elsewhere: as a structured way to make assumptions visible and testable.
If NAB’s observed trading price of $37.85 implies a certain combination of growth and discount rate, the relevant question is whether that combination seems reasonable given current conditions. Four macroeconomic variables feed directly into the DDM’s inputs:
The DDM does not reveal what a stock is worth. It reveals what a stock is worth given specific assumptions, and whether those assumptions are consistent with the price the market is already charging.
Investors wanting to contextualise the NAB estimate against broader market pricing will find our full explainer on DDM valuation and current ASX market conditions, which examines the ASX 200 dividend yield against its 10-year historical average, the parallels between the current AI-driven rally and earlier speculative periods, and what the Gordon Growth Model implies for whether income-paying sectors are fairly priced today.
Understanding that distinction is what separates investors who use the model from investors who are used by it.
This article is for informational purposes only and should not be considered financial advice. Investors should conduct their own research and consult with financial professionals before making investment decisions. Past performance does not guarantee future results. Financial projections are subject to market conditions and various risk factors.
For eligible Australian investors, the difference between a DDM built on cash dividends and one built on grossed-up franked dividends is not a minor modelling refinement. For NAB alone, it is a gap of more than $15 in estimated fair value: $35.74 on a cash-only basis versus $51.66 with franking credits included.
The practical step is to run both versions for any fully franked stock under evaluation, understand which version applies to the investor’s specific tax situation, and treat the gap between the two as a measure of the tax advantage being either captured or left unclaimed. If NAB at $37.85 appears undervalued on the grossed-up DDM and roughly fairly valued on the cash-only DDM, the next question is whether the investor’s tax position entitles them to capture that franking benefit, and how confident they are in the growth and discount rate assumptions underpinning both estimates.
$35.74 (cash dividend DDM) versus $51.66 (grossed-up DDM including franking credits): same model, same stock, very different number. The difference is not in the formula. It is in the dividend input, and getting that input right depends on knowing who the investor is.
The Dividend Discount Model values a company by discounting all its expected future dividend payments back to today's dollars, using the formula: share price equals annual dividend divided by the difference between the discount rate and the dividend growth rate.
Franking credits gross up the dividend input used in the DDM; for NAB's $1.70 fully franked dividend, the grossed-up figure is approximately $2.44, which raises the averaged DDM estimate from roughly $35.74 to approximately $51.66 for investors who can fully utilise or receive a refund of those credits.
Investors who receive the full value of franking credits, such as SMSFs in pension phase taxed at 0% and qualifying low-income retirees, should use the grossed-up dividend input, while top-marginal-rate taxpayers and non-resident investors should use the cash dividend only.
Australian major banks like NAB are well suited to DDM valuation because they pay large, consistent, fully franked dividends across multiple economic cycles, operate under regulated capital requirements that limit reinvestment, and have maintained or grown dividends over decades.
Retail applications commonly use a discount rate of 9-10% and a long-run dividend growth rate of 2-3% for Australian major banks, but running a full scenario matrix across multiple combinations is more informative than selecting a single pair of assumptions.