
Citi Names 7 China Data Centre Stocks as AI Buildout Accelerates
23 mins ago

Temple & Webster has reported its most profitable April in company history, posting $2.5 million in EBITDA for the month, according to a trading update released on 13 May 2026. The result lands at a time when Australian consumer confidence sits at historically low levels, making the margin expansion harder to dismiss as a cyclical tailwind. Three months ago, the Temple & Webster share price fell 25.57% after H1 FY26 earnings disappointed investors who had expected stronger near-term profitability. The May trading update signals a deliberate reversal of that posture. What follows breaks down what drove the April result, what the FY26 and FY27 guidance figures mean in practice, and what the strategic shift implies for investors tracking the stock.
The $2.5 million April EBITDA figure is not just a strong month. It is the highest April profitability Temple & Webster has ever recorded.
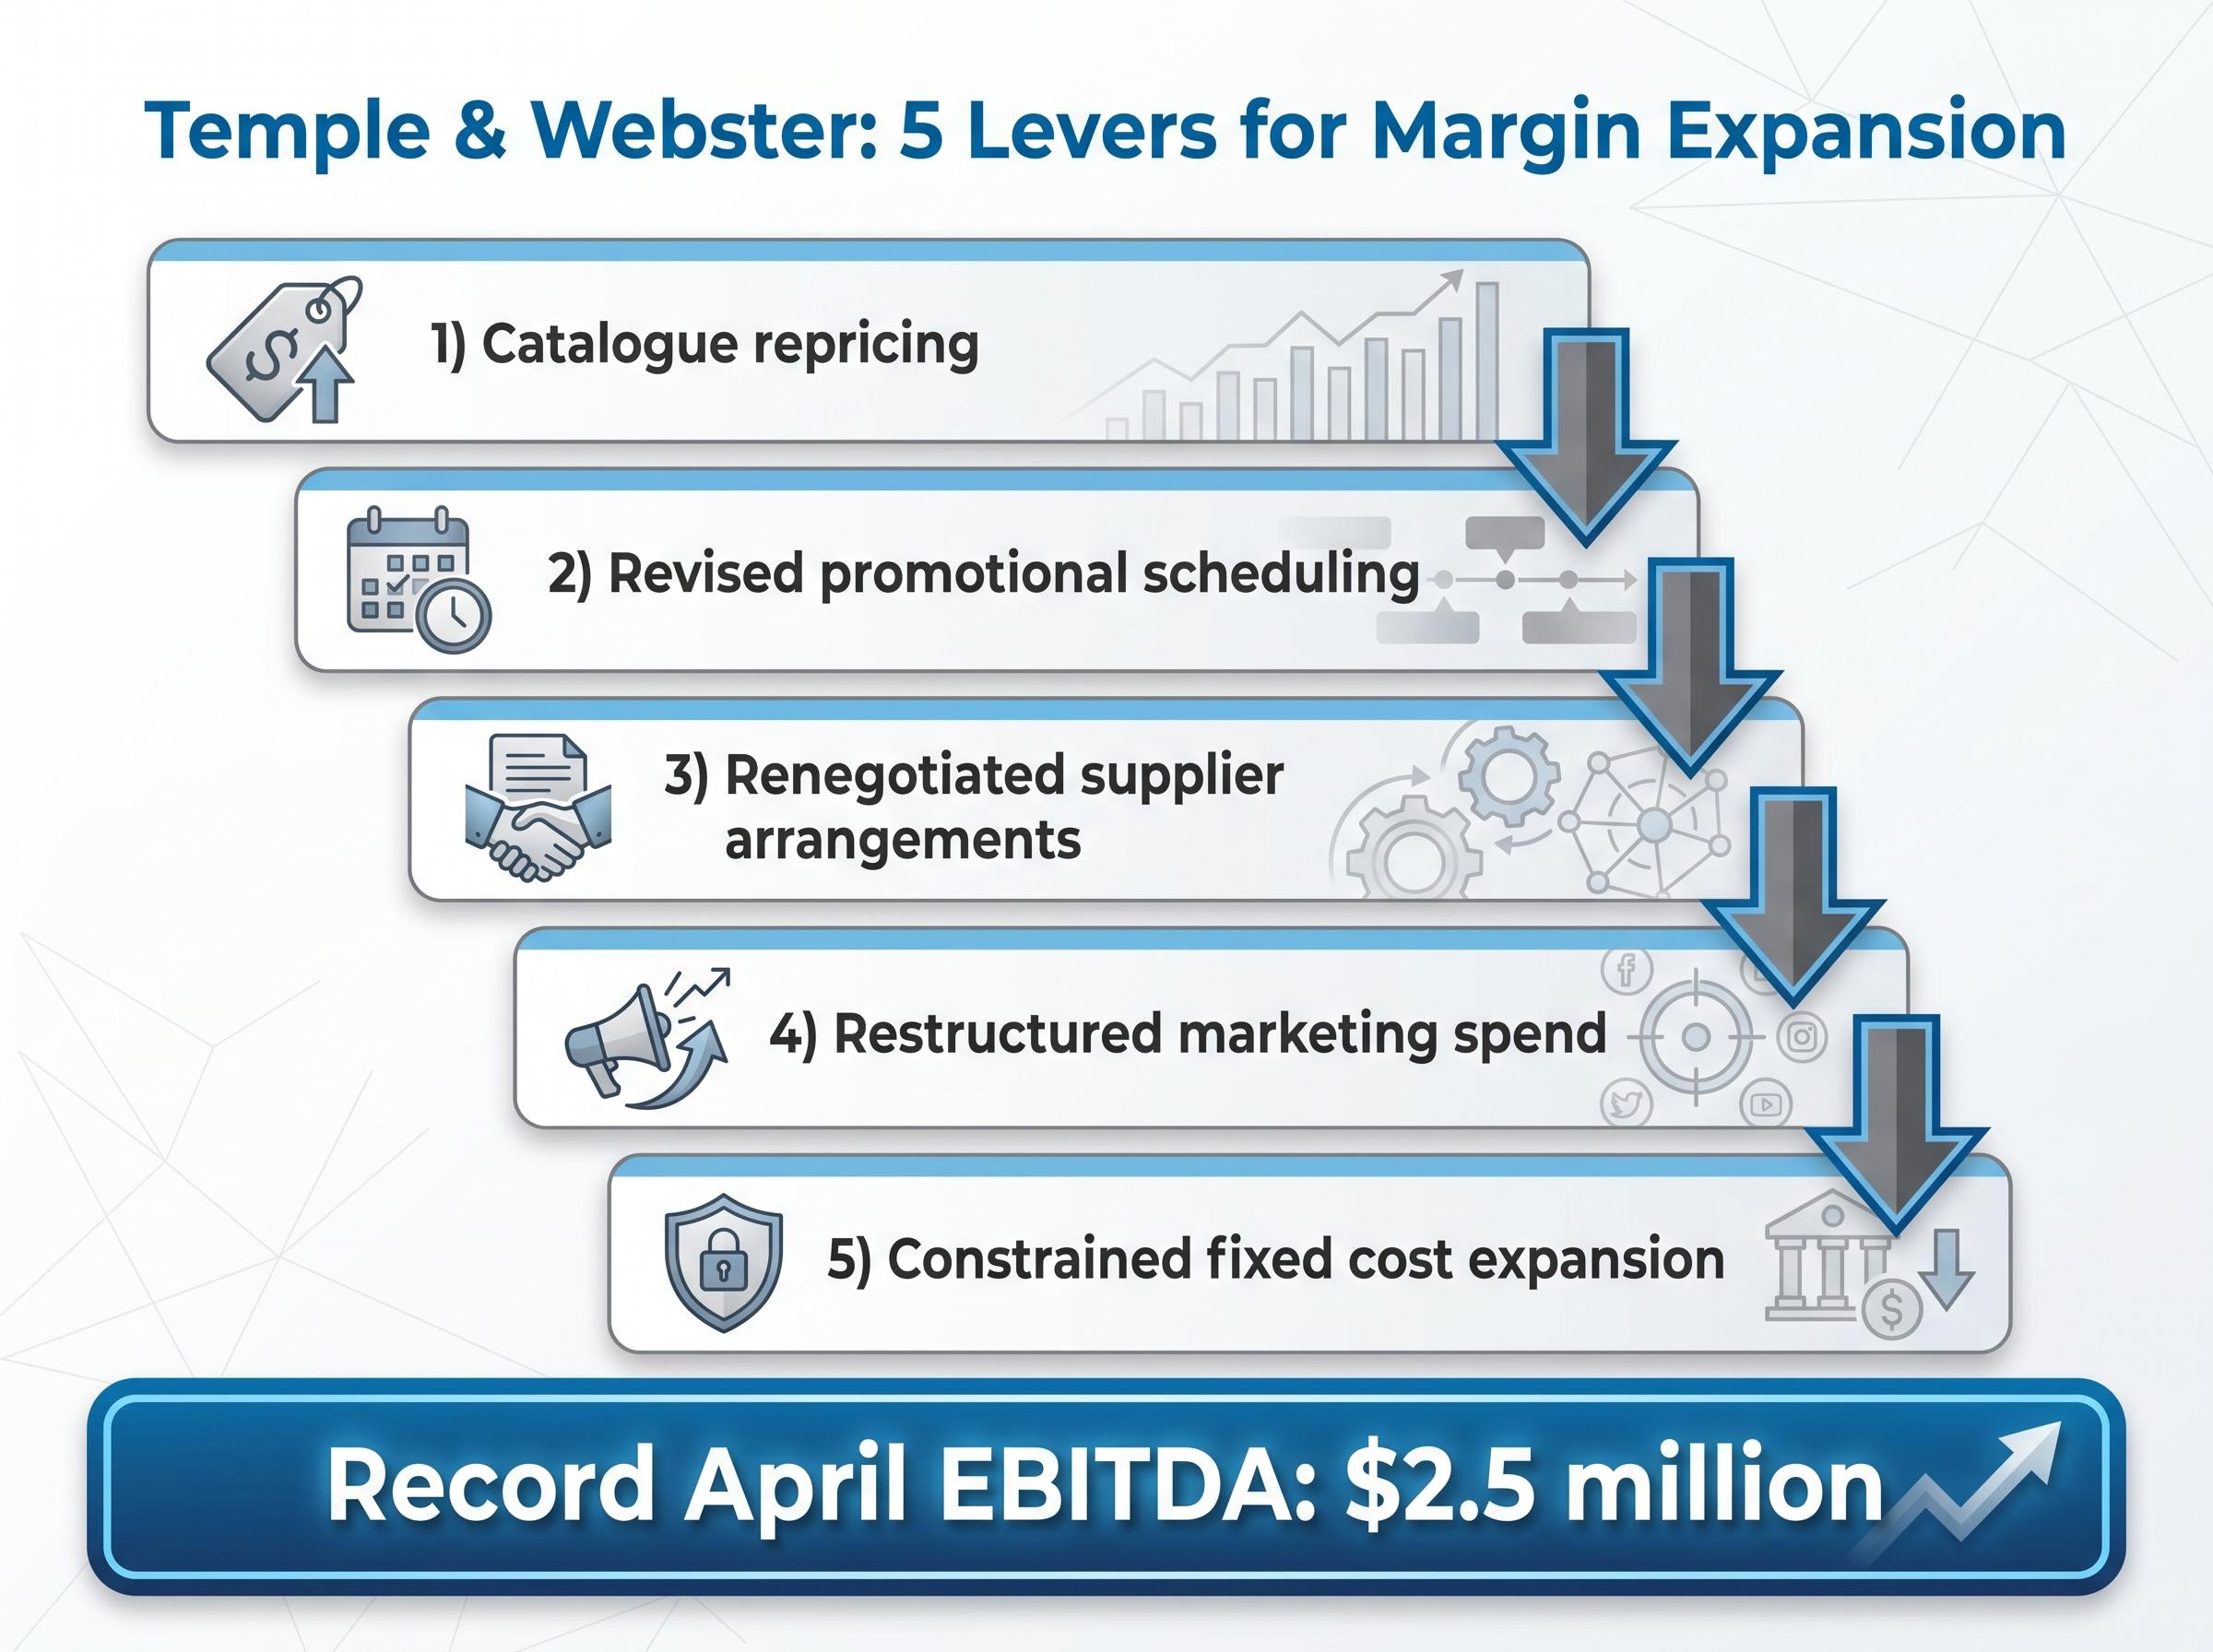
Record April EBITDA: $2.5 million The highest April profitability in Temple & Webster’s company history, reported 13 May 2026.
That number carries more weight when measured against where the business sat at the half-year mark. H1 FY26 reported EBITDA was $13.5 million, up just 2.2% year-on-year. Excluding the New Zealand start-up investment, EBITDA was $14.9 million, representing a 4.0% pre-NZ margin. A single month at the April run-rate implies an annualised earnings trajectory well above the H1 pace.
The company identified Q4 FY26 as the primary driver of FY26 earnings uplift, making April the clearest monthly signal yet of whether the strategy shift is translating into real numbers.
For investors who sold or reassessed their position after the February selloff, this is the first concrete monthly data point showing the margin thesis is producing results.
The April result did not arrive from a single decision. Management described five discrete operational changes, each representing a deliberate trade-off between near-term growth investment and profitability.
Management characterised the shift as a move from prioritising market share to balancing profit and growth. This is a distinction worth noting: the company has framed the changes as strategic recalibration, not a defensive cost-cutting exercise triggered by panic.
The timing was driven by macroeconomic pressure. Consumer confidence had deteriorated to historically low levels since the prior trading update, creating an environment where aggressive growth spending carried diminishing returns. The question for investors is whether these levers represent structural capability the business can maintain, or a one-time reset that reverses when growth investment resumes.
In H1 FY26, Temple & Webster’s stated approach was unambiguous: prioritise market share gains through price competitiveness and marketing investment. The company accepted the 3.5% FY26 EBITDA margin guidance as the cost of that strategy, treating it as the floor rather than the ceiling. Revenue grew 19.8% year-on-year to $375.9 million on that basis, and the pre-NZ margin of 4.0% compared against H1 FY25’s 4.2%, a compression that reflected deliberate reinvestment rather than structural deterioration.
Investors disagreed with the trade-off. The 25.57% share price decline following the 12 February 2026 results was a clear signal that the market had expected a stronger near-term profitability trajectory, not a commitment to spending through a consumer downturn.
The May 2026 trading update reframes that posture. CEO Mark Coulter described the shift as a prudent response to Australian economic uncertainty.
The sector rotation pressures compressing consumer discretionary valuations across the ASX in 2026 extend well beyond Temple and Webster: three consecutive RBA rate hikes lifting the cash rate to 4.35%, headline inflation at 4.6%, and a simultaneous guidance downgrade from CSL combined to push the consumer discretionary index down 16% year to date, creating the macro environment in which the April result landed.
CEO Mark Coulter characterised the strategic pivot as a “prudent response” to deteriorating consumer conditions, repositioning the business to balance profit generation with growth rather than prioritising market share at the expense of near-term earnings.
| Dimension | H1 FY26 Posture (Feb 2026) | Updated Posture (May 2026) |
|---|---|---|
| Margin priority | 3.5% EBITDA margin as floor; accepted compression | Active margin expansion via five operational levers |
| Growth investment | Aggressive price and marketing spend for share gains | Moderated and restructured; higher-return allocation |
| Market share focus | Primary objective; revenue growth at nearly 20% | Balanced against profitability; growth maintained but not at all costs |
The distinction matters for valuation. If the April result marks the start of a durable shift, the earnings trajectory changes materially. If it is a temporary tactical adjustment before the company reverts to growth-first spending, the improvement may prove short-lived.
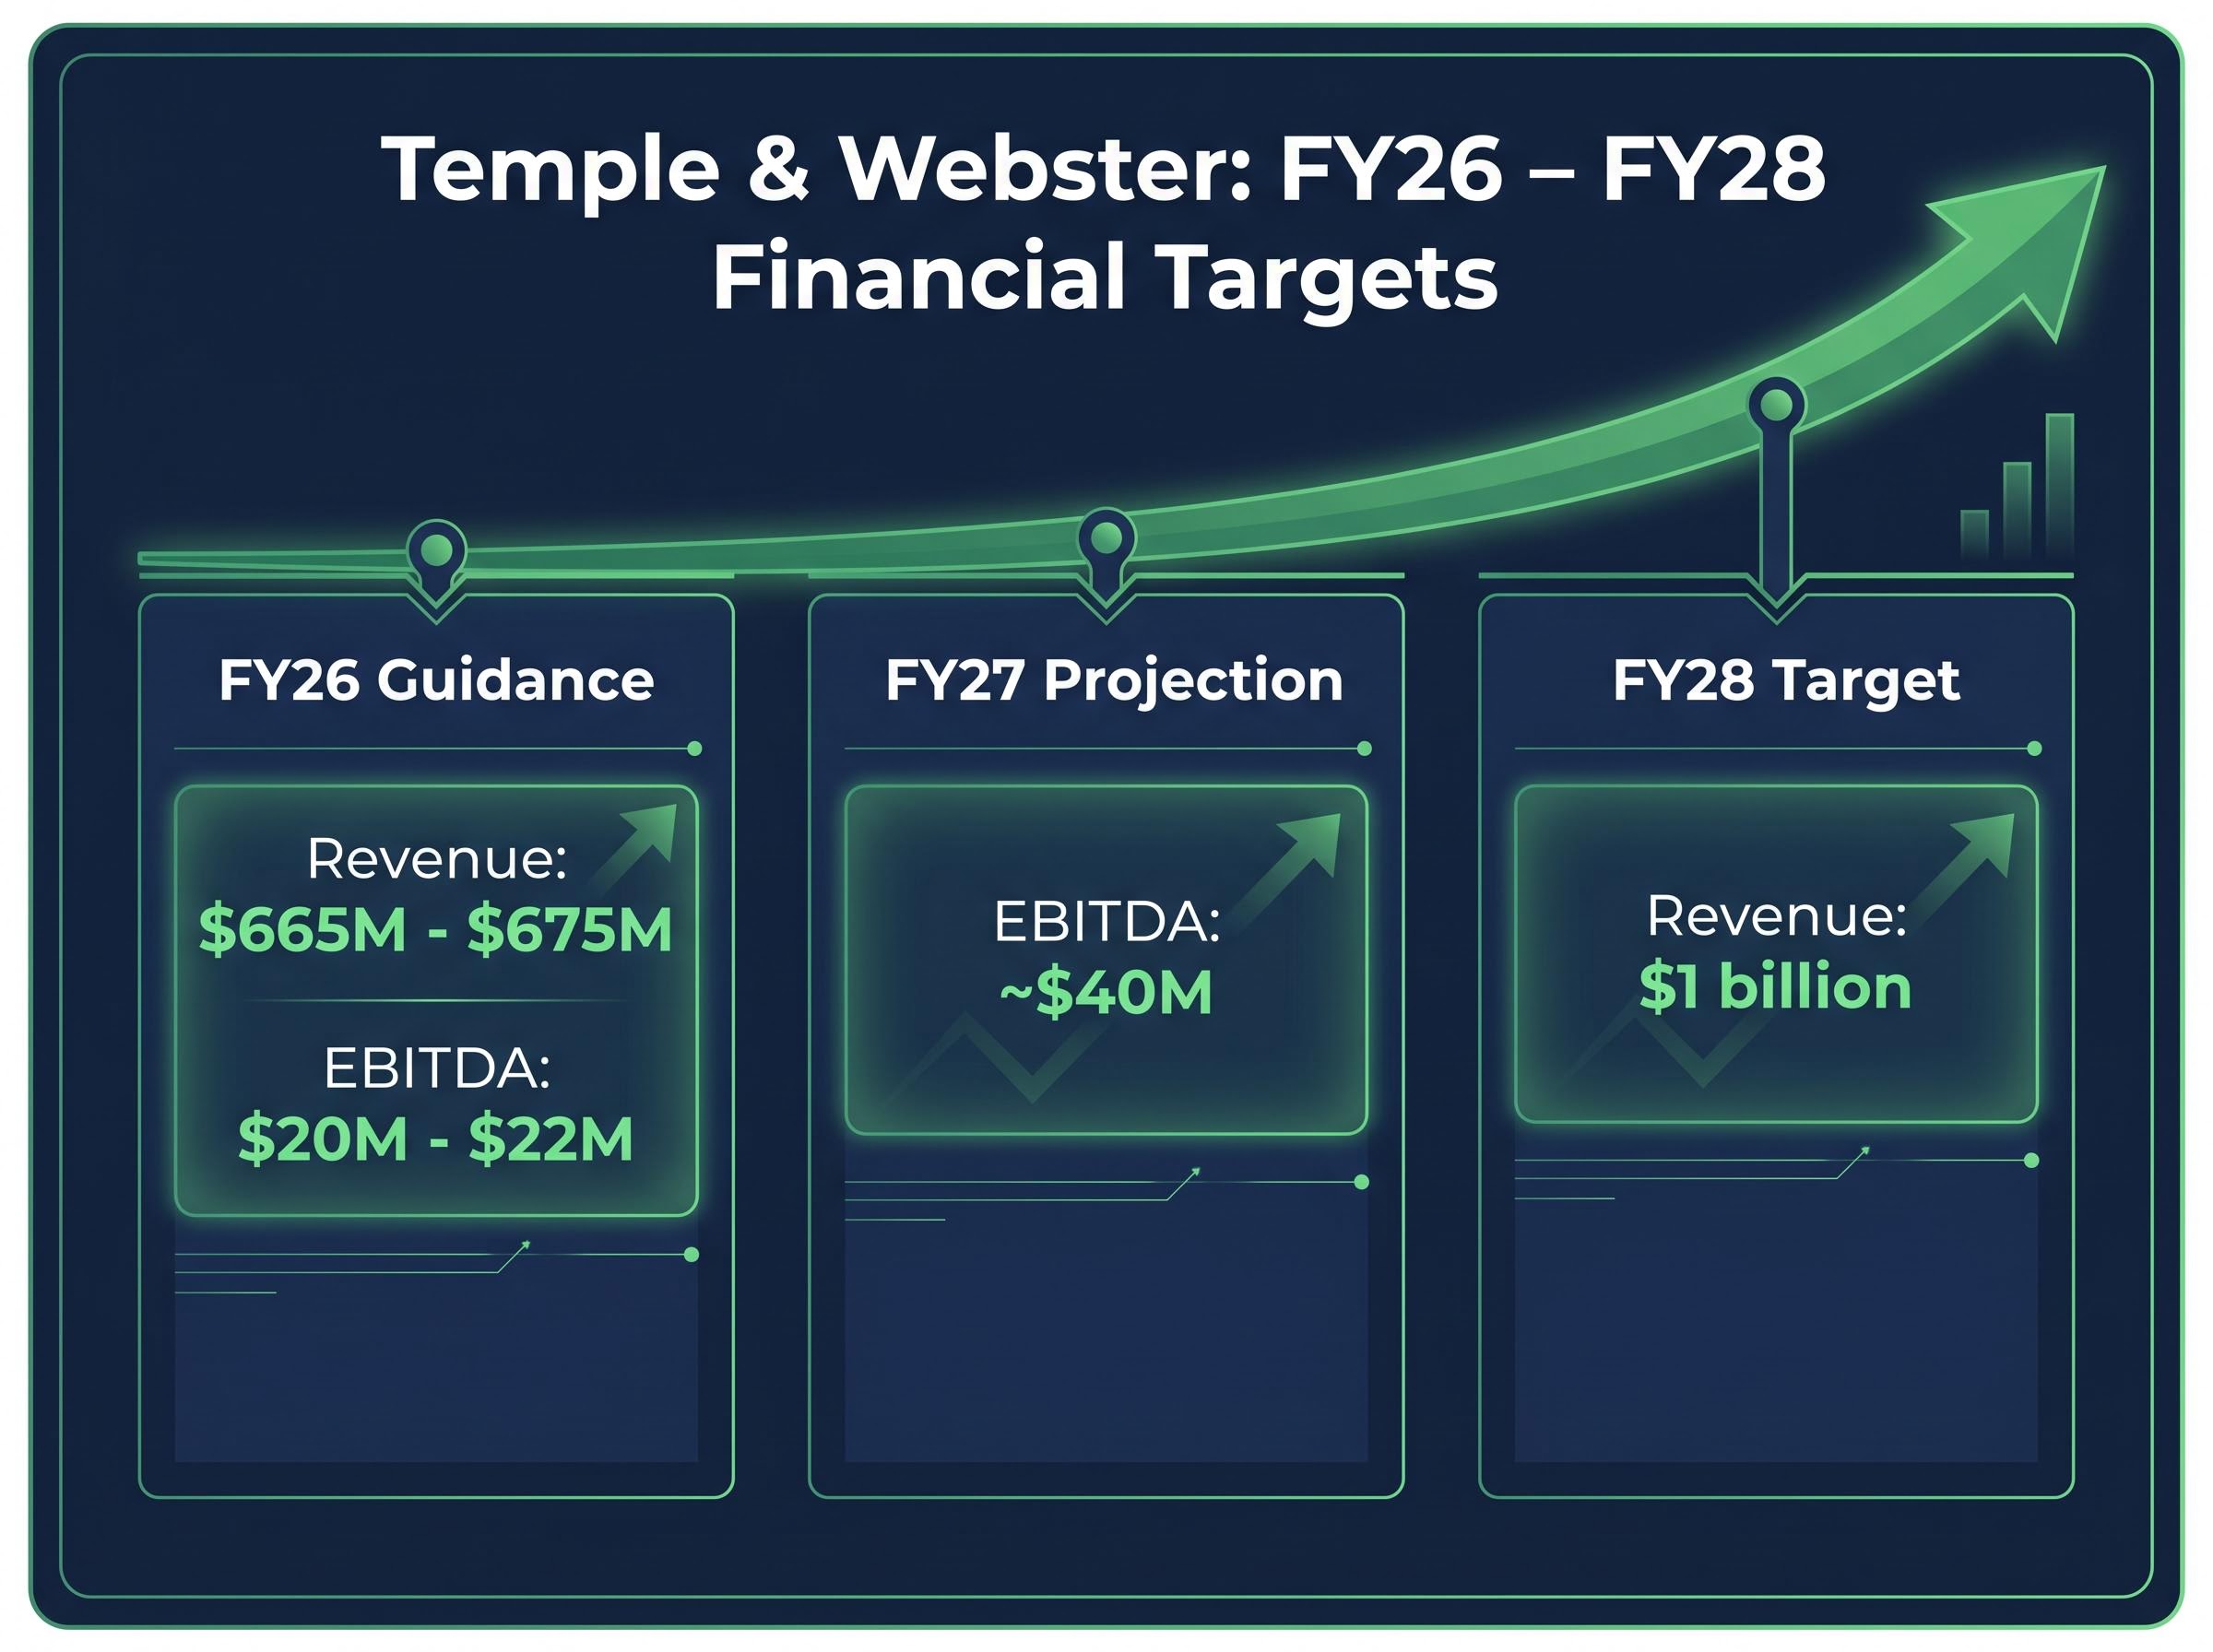
The trading update provided FY26 full-year guidance of $665 million to $675 million in revenue, representing 11-12% year-on-year growth. FY26 EBITDA guidance sits at $20 million to $22 million, implying 6-17% expansion on the prior year.
Management commentary went further. Based on the current margin run-rate, FY27 EBITDA is projected at approximately $40 million, roughly double the FY26 midpoint, even under a conservative low-growth scenario.
FY27 EBITDA projection: approximately $40 million Based on the current margin run-rate under a “low growth” scenario, roughly doubling the FY26 midpoint of $21 million.
Beyond FY27, the company reiterated its longer-dated target of $1 billion in revenue by FY28, framing the medium-term investment case around continued category share gains and margin expansion operating simultaneously.
| Metric | FY26 Guidance | FY27 Projection | FY28 Target |
|---|---|---|---|
| Revenue | $665M-$675M | Not specified | $1 billion |
| EBITDA | $20M-$22M | ~$40M | Not specified |
At the current enterprise value of AUD 555.72 million and trailing twelve-month (TTM) EBITDA of AUD 19.07 million, TPW trades at an EV/EBITDA multiple of 29.13x as at 12 May 2026. Against the FY26 EBITDA midpoint of $21 million, the forward multiple compresses to approximately 26.5x. Against the FY27 projection of $40 million, it drops below 14x. The company also held $160.6 million in cash as at H1 FY26, up 15.3% year-on-year, providing optionality for both organic investment and capital management.
These are the numbers the stock will be benchmarked against for the next twelve months.
On 23 April 2026, Temple & Webster announced a leadership restructure effective 1 July 2026. Mark Coulter will move to the role of Executive Chair. Susie Sugden will return as Chief Executive Officer. The structure positions Coulter in a strategic oversight role while Sugden takes operational responsibility for executing the strategy the May update has validated.
For investors wanting to assess whether the operational improvements validated by the April result can survive a leadership handover, our full explainer on the Temple and Webster CEO transition covers Susie Sugden’s background scaling e-commerce businesses internationally, the remuneration structure tying her incentives to earnings per share growth, and the strategic rationale behind Conrad Yiu’s newly formed technology committee overseeing the company’s AI roadmap.
Management commentary identified several performing segments and strategic initiatives that frame the next leg of growth:
The $160.6 million cash position provides meaningful flexibility. Management commentary flagged the M&A environment as more favourable given the strengthened balance sheet and improved profitability, though no specific acquisition targets have been named. Capital management options, including potential buybacks, remain available but unannounced.
The valuation picture has already moved materially from the elevated multiples of late 2025. The EV/EBITDA of 29.13x as at 12 May 2026 reflects the post-February selloff reset, built on an enterprise value of AUD 555.72 million and TTM EBITDA of AUD 19.07 million.
The 25.57% decline from February repriced the stock for a growth-without-margin scenario. The May trading update changes that calculus. If FY26 EBITDA lands at the $21 million midpoint, the forward multiple compresses to the mid-twenties. If the FY27 projection of $40 million materialises, the stock trades below 14x forward earnings at current prices.
The improvement is concentrated in Q4. One record month does not constitute a trend. The FY26 full-year result, expected in August 2026, is the next major validation point. Investors will be watching whether the margin expansion holds across May and June, or whether April represented a seasonal peak that flatters the quarterly aggregate.
The forward multiple compression only works if the earnings trajectory holds. That remains unproven over a full reporting cycle.
The April EBITDA record carries weight precisely because of the conditions under which it was achieved. Consumer confidence at historically low levels should, in theory, compress discretionary spending on furniture and homewares. That Temple & Webster posted its best-ever April profitability against that backdrop suggests the operational changes are producing margin improvement that is at least partly independent of demand conditions.
The consumer sentiment collapse that frames this result was not a gradual drift: the Westpac-Melbourne Institute Consumer Sentiment Index fell to 80.1 in April 2026, the steepest monthly decline since the COVID-19 pandemic, dragging consumer discretionary to the hardest-hit position across the ASX 200 with seven constituents hitting fresh 52-week lows in a single week.
Three forward milestones will determine whether this moment marks a genuine inflection. The FY26 full-year result in August 2026 will show whether Q4 delivered consistently or relied on a single strong month. Susie Sugden’s first results as CEO, likely covering H1 FY27, will test whether the strategy survives a leadership transition. And the FY27 EBITDA doubling projection to approximately $40 million will be measured against whether normalised growth conditions support both margin expansion and revenue acceleration toward the $1 billion FY28 target.
The risk is straightforward. Pulling back on market share investment in a soft consumer environment is prudent. Maintaining that restraint when confidence recovers and competitors accelerate may prove more difficult. The $1 billion revenue target remains the ultimate scorecard for whether this pivot strengthened the business or merely paused its ambition.
This article is for informational purposes only and should not be considered financial advice. Investors should conduct their own research and consult with financial professionals before making investment decisions. Forward-looking statements, including FY26 guidance, FY27 projections, and the FY28 revenue target, are subject to change based on market conditions and company performance.
EBITDA stands for Earnings Before Interest, Tax, Depreciation and Amortisation, and is a key measure of a company's core operating profitability. For Temple and Webster investors, it is the primary metric management uses to track margin performance, with the company reporting a record $2.5 million in April 2026 and guiding for $20-22 million across full-year FY26.
The Temple and Webster share price declined 25.57% following the H1 FY26 results released on 12 February 2026, after investors reacted negatively to weaker-than-expected near-term profitability, with reported EBITDA growing only 2.2% year-on-year to $13.5 million under a strategy that prioritised market share over margins.
Management projected FY27 EBITDA at approximately $40 million, roughly double the FY26 midpoint of $21 million, based on the current margin run-rate under a conservative low-growth scenario.
Temple and Webster implemented five operational changes: catalogue repricing, revised promotional scheduling, renegotiated supplier arrangements, restructured marketing spend toward higher-return channels, and constrained fixed cost expansion by moderating headcount and infrastructure growth.
Susie Sugden will return as Chief Executive Officer effective 1 July 2026, while Mark Coulter moves to the role of Executive Chair, with Sugden taking operational responsibility for executing the company's growth and margin strategy.


